
October 2026 edition
JOA Job Market Report, October 2026: New job postings flat as North America slows and Europe edges up
Employer job postings in Europe and North America: the first month-on-month reading from a fixed panel of employers' own recruiting systems, and a snapshot of 2,053,804 open postings on 31 October 2026
Listen · Read as Markdown · Aggregate data (CSV, 4,012 rows) · Data dictionary · PDF edition
New job postings were flat in October. In a fixed panel of employers that JOA has read on the same recruiting systems since before September, postings dated 1 to 28 October were 1.2% below the same days of September without Greenhouse (95% interval plus or minus 2.1 points) and 1.7% above with it (plus or minus 1.9), or 2.3% below and 0.2% above with September's Labor Day replaced by an ordinary Monday; across all the checks in section 2 the change stays between -2.9% and +2.5%. Greenhouse makes the difference because it rose most (+14.7%) and carries about a fifth of the panel's postings. North America fell by 5.1% (8.3% with Labor Day replaced) while Europe rose by 4.3%: the United States fell by 4.9%, and the United Kingdom and Germany rose by 9.4% and 13.8%. Indeed's new postings also rose in the United Kingdom, the Netherlands and Spain, by less than in JOA's panel. On 31 October JOA tracked 2,053,804 open postings in Europe and North America; the stock grew mostly because JOA added sources, and that growth is not read as a change in the market.
Listen to this report
about 61 minutesNarrated with a synthetic voice (text-to-speech). Tables, charts and references are not read. Voice: Kokoro bf_emma (synthetic). Read the text instead
Chapter 1 of 14: Summary
- FlatNew postings, October against September-1.2% without Greenhouse, +1.7% with it; between -2.9% and +2.5% across all checks
- -5.1% vs +4.3%North America against Europesix recruiting systems; -8.3% and +4.6% with Labor Day replaced by an ordinary Monday
- US -4.9%, UK +9.4%, Germany +13.8%Countries moving outside their intervals, with Australia (-9.9%)all others within theirs on the main figures
- 2,053,804Open postings in Europe and North America, 31 OctoberNorth America 1,505,926, Europe 547,878; 2,503,380 in total
Contents
- 1. Key findings
- 2. Month on month: new postings by a fixed panel of employers
- 3. October in context: official statistics and the wider debate
- 4. The stock on 31 October: Europe and North America
- 5. Pay transparency in Europe: the law, the evidence and JOA's postings
- 6. Hiring dynamics
- 7. Recruiting systems: who carries the postings
- 8. What changed in JOA's data in October, and what is not compared
- 9. Methodology
- 10. Limitations and further research
- 11. Next edition
- 12. About this report
- 13. AI disclosure
- Downloads
- References
- Cite this report
1. Key findings #
- New postings held steady. In a fixed panel of employers, the same employers on the same recruiting systems in both months, new postings dated 1 to 28 October were 1.2% below the same days of September without Greenhouse (plus or minus 2.1 points) and 1.7% above with it (268,780 against 264,291 from 15,369 employers, plus or minus 1.9). Greenhouse changes the result because it rose most (+14.7%; Teamtailor +10.8%, the other five between -12.7% and +1.2%) and carries about a fifth of the panel's postings; JOA corrected Greenhouse locations in October, which is why it is left out of the regional figures. With Labor Day replaced by an ordinary Monday the two figures are -2.3% and +0.2%, and across all the checks in section 2 (a wider panel, the holiday adjustment and a three-week window) the change stays between -2.9% and +2.5%.
- North America slowed, Europe did not. On six systems whose country coding is stable, North American new postings fell by 5.1% (plus or minus 3.5) and European postings rose by 4.3% (plus or minus 3.3). With September's Labor Day replaced by an ordinary Monday, North America fell by 8.3%.
- Countries. The United States, Australia, the United Kingdom and Germany moved by more than their intervals (section 2); Canada (-6.7%) does so under two of the checks.
- Against other data. Official statistics describe a US labour market with little hiring (September payrolls +29,000, unemployment 4.2%) and a euro area unemployment rate stable at 6.5% but with 122,000 more people out of work. Indeed's new postings index ranks ten countries in a weakly similar order (rank correlation 0.59) and also rose in the United Kingdom, the Netherlands and Spain; the two disagree for Germany, France, Canada and the United States.
- What employers are hiring for. Healthcare is the largest role family in North America (21.6% of classified postings), Engineering in Europe (13.8%). Job titles that mention AI, machine learning or data science make up 2.1% of new European and 1.5% of new North American panel postings, unchanged from September.
- Pay transparency. JOA detected a pay figure in 44.4% of Austrian and 5.8% of German open postings, a lower bound in both countries. Across 34 European countries, the four that have required pay in job advertisements since 2011 to 2019 (Austria, Lithuania, Slovakia and Latvia) have among the highest detected shares, 30.9% on average against an EU-27 average of 10.1%; detection is weak in many languages, so this is an association measured with a lower bound (section 5.5). In US own-site postings, JOA detected pay in a structured field in 26.0% of postings in the 10 jurisdictions with a verified pay-range posting law, against 21.2% in 28 comparison states.
- Posting dates. 42.2% of dated postings in the Netherlands carry a posting date more than 90 days old, against 15.1% in Canada.
- Concentration. The ten largest employers hold 24.8% of Norway's postings and 6.6% of those in the United States.
- Recruiting systems. Of the postings JOA reads on identified recruiting systems, Workday carries 47.7% in North America and 23.1% in Europe; counted by employers, the picture is fragmented (Greenhouse 12.0% in North America, Personio 14.2% in Europe). These are shares of JOA's coverage, not market shares, and cannot yet be followed over time (section 7).
- Pay transparency laws. Five EU member states had fully transposed the Pay Transparency Directive by October 2026; research on earlier laws finds that pay in job ads raised starting pay or women's pay, and that pay gap reporting narrowed gender gaps in Denmark and the UK but not in Austria (section 5).
About the data. This report analyses the job postings that employers publish on their own recruiting systems and careers pages (and a few public employment service feeds), as served by JOA's API (jobopportunitiesapi.org) at 23:39 UTC on 31 October 2026: 2,503,380 open postings from 137,090 employers, of which 2,053,804 are located in Europe and North America and 150,534 have no resolved country. Month-on-month changes come only from the fixed panel; totals are not compared with September, because JOA added sources in October (section 8). JOA is a one-person data business that sells API access (About this report).
| Finding | Evidence | Strength |
|---|---|---|
| New postings flat, October against September | Fixed panel: -1.2% without Greenhouse, +1.7% with it; between -2.9% and +2.5% across panel definitions, windows and holiday treatment | Strong as a measurement of the panel; one month of data |
| North America down, Europe up | Both outside their intervals under every definition tested; North American fall consistent with US official data | Moderate |
| Country changes (US, UK, Germany, Australia) | Outside intervals; small panels outside the US; weak agreement with Indeed | Moderate for the US and the UK, weak elsewhere |
| Stock structure, posting-date ages, concentration, work model | One consistent snapshot; levels reflect JOA's coverage | Strong for structure, not for levels |
| Austria against Germany, US law jurisdictions | Comparison within the same recruiting systems; lower bounds | Strong for the direction of the gap, not its size |
2. Month on month: new postings by a fixed panel of employers #
This is the first edition with a month-on-month comparison. Because JOA added many sources in October (section 8), comparing all postings with September would mostly measure JOA's growth. The comparison therefore follows a fixed panel: employer and recruiting-system pairs that JOA first read before 31 August and that had open postings at the September snapshot (4 October) and at this one (31 October). It counts postings by their posting date, 1 to 28 October against 1 to 28 September, two windows with four of each weekday, including postings that have since closed.
The panel covers seven recruiting systems whose posting dates JOA captures consistently, as in the September edition: SmartRecruiters, Greenhouse, Ashby, Lever, Workable, Teamtailor and Breezy. Regional and country figures leave out Greenhouse, because a location correction applied in October to open Greenhouse postings left many of its closed September postings without a country (section 8).
| Panel | Employers posting | September | October | Change | 95% interval | Labor Day replaced | 1 to 21 only | Wider panel |
|---|---|---|---|---|---|---|---|---|
| Seven systems | 15,369 | 264,291 | 268,780 | +1.7% | plus or minus 1.9 | +0.2% | +2.5% | +0.9% |
| Six systems (without Greenhouse) | 10,640 | 216,276 | 213,722 | -1.2% | plus or minus 2.1 | -2.3% | -0.6% | -1.8% |
| North America (six systems) | 6,107 | 89,677 | 85,137 | -5.1% | plus or minus 3.5 | -8.3% | -4.6% | -5.9% |
| Europe (six systems) | 4,722 | 85,142 | 88,767 | +4.3% | plus or minus 3.3 | +4.6% | +6.2% | +3.9% |
Postings by posting date, including postings that have since closed. Employers posting: employer and system pairs with at least one posting in the two windows. 'Labor Day replaced' counts 7 September as the average of September's other Mondays; '1 to 21 only' compares the first three weeks, which reduces the effect of postings not yet captured at the end of October; 'Wider panel' adds employers that had no open postings left on 31 October, counted with their actual (often zero) October postings. Intervals in points, clustered by employer (section 9).
The headline holds under each check. Replacing Labor Day matters most: North America's fall deepens to 8.3%, while 12 October (Columbus Day in the United States, Thanksgiving in Canada) shows no dip. Without Greenhouse and with Labor Day replaced, the change (-2.3%, wider panel -2.9%) is a small fall just outside its interval. The wider panel, which does not require employers to still have open postings on 31 October, lowers every change by about 0.4 to 0.8 points.
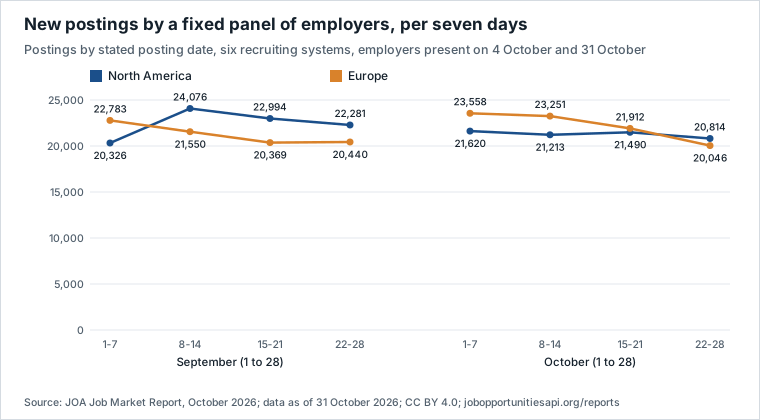
North American postings dipped in the first week of September, which contains Labor Day (905 postings on 7 September against about 4,000 on an ordinary Monday), then ran above every October week. Europe ran higher in October's first two weeks. Its last October week is lower, partly because some postings dated 26 to 28 October had not yet been read by the snapshot three days later: European postings on those three days were 17% below the same weekdays earlier in October, a drop September's last days did not show. The 1 to 21 comparison avoids that.
By country #
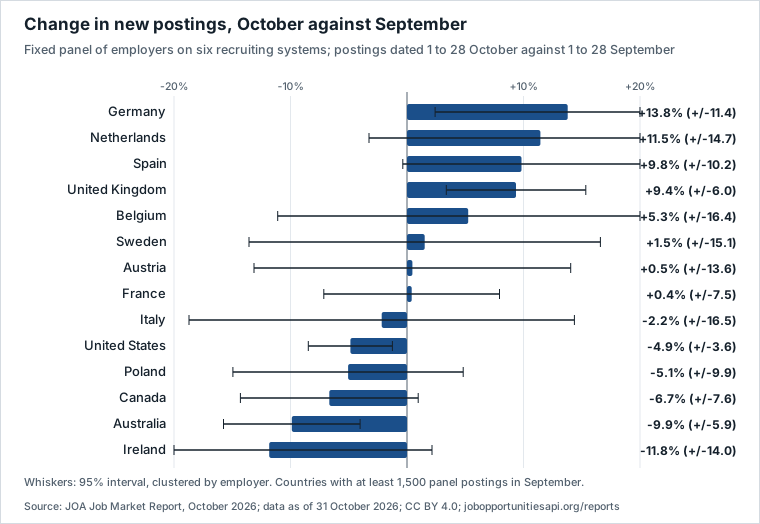
Four countries moved by more than their interval: the United States (-4.9%, plus or minus 3.6) and Australia (-9.9%, plus or minus 5.9) down, the United Kingdom (+9.4%, plus or minus 6.0) and Germany (+13.8%, plus or minus 11.4) up. With 14 countries tested, about one could cross its interval by chance, and Germany's interval nearly reaches zero. Panels are small outside the United States (5,692 panel employers), the United Kingdom (1,851), Canada (936) and France (887), so most country changes should be read as direction, not size. With Labor Day replaced, the US fall is 8.1%; Canada, which also had Labour Day on 7 September, falls by 10.1%, and by 8.5% (plus or minus 7.7) on the wider panel, so it crosses its interval under two checks.
JOA's panel and Indeed's postings index #
Indeed Hiring Lab publishes daily job postings indexes by country under a CC BY 4.0 licence [1]. Its new postings index (postings up to seven days old, not seasonally adjusted) is the closest counterpart to JOA's panel. The comparison uses 1 to 23 of each month, the latest day in Indeed's data; because Indeed's index counts postings up to seven days old, its windows reach about a week further back.
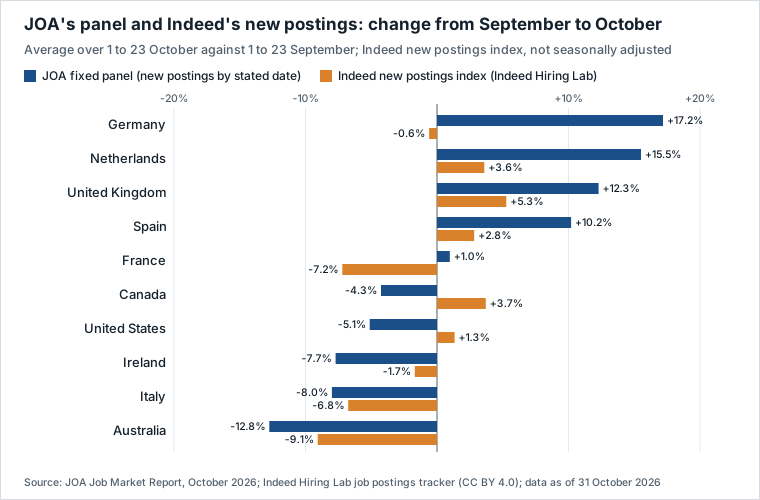
The two series agree only weakly (rank correlation 0.59 across ten countries, 0.39 against Indeed's seasonally adjusted index). Both put the United Kingdom (JOA +12.3%, Indeed +5.3%), the Netherlands and Spain among the four largest rises and Australia (JOA -12.8%, Indeed -9.1%) and Italy among the three largest falls. They disagree for Germany (JOA +17.2%, Indeed -0.6%), France (JOA +1.0%, Indeed -7.2%), Canada (JOA -4.3%, Indeed +3.7%) and the United States (JOA -5.1%, Indeed +1.3%). The sources measure different things: Indeed covers all employers and intermediaries advertising on its site, while JOA's panel follows established employers on six systems popular with technology and service firms, and counts each role once at the employer.
What changed in the mix #
- AI-related roles. Job titles mentioning AI, machine learning, generative AI or data science account for 2.1% of the panel's new European postings in both months and 1.5% in North America in both months (six systems). JOA counts titles only; Indeed's 7.3% for the US counts postings that mention AI anywhere [2].
- Work model. Among new panel postings with a work model in the posting data, the remote share was 17.3% in North America in both months and 7.6% in Europe in October (7.7% in September).
- Role families and pay. The month-on-month mix of role families and the share of postings with a detected pay figure are not compared, because JOA's classification and pay detection both changed during the two months (section 8).
3. October in context: official statistics and the wider debate #
Official statistics published by 1 November describe two labour markets moving at different speeds, with hiring subdued on both sides of the Atlantic. All figures below are external and dated.
United States and Canada #
The US data for October itself were not yet out on 1 November: the October Employment Situation is scheduled for 6 November [3] and the September job openings survey had not been published. The latest figures therefore describe September and August. Employers added 29,000 jobs in September, well below forecasts, and the unemployment rate rose to 4.2% [4, 5]. JOLTS counted 7,079,000 job openings at the end of August (preliminary), down from 7,335,000 in July, with an openings rate of 4.3%, a hires rate of 3.3% and a quits rate of 1.9% [6, 7]. Reuters described the picture as job openings falling while layoffs remained low [7], and Yahoo Finance called it a "low hire, low fire" job market [8]. On 28 October the Federal Reserve kept its target range at 3-3/4 to 4 percent, saying that job gains had kept pace with the workforce and that the unemployment rate had changed little; two members voted for an increase [9].
Indeed's job postings index, which counts all postings on its US site, stood at 103.8 on 16 October, 0.3% higher than a month earlier and 2.8% above a year earlier, while new postings continued to "drift sideways" [2]. The Wall Street Journal described a "deep freeze" in the labour market that is hitting college-educated workers hard [10].
In Canada, employment fell by 68,000 in September and the unemployment rate rose to 6.5% [11, 12]. Job vacancies were little changed in August at 507,200, a vacancy rate of 2.8% [13].
Europe #
The euro area unemployment rate was 6.5% in September, unchanged from August but up from 6.3% a year earlier, and the EU rate 6.2%; the number out of work rose by 122,000 in the euro area over the month [14]. The euro area job vacancy rate fell to 2.1% in the second quarter of 2026, from 2.3% in the first [15]. On 29 October the ECB left its rates unchanged and described growth in employment and the labour force as subdued [16]. Indeed's euro area index of all postings on its site was 2.0% lower than a month earlier and 12.6% lower than a year earlier [17].
- United Kingdom. Vacancies fell by 21,000 (2.9%) to 691,000 in July to September 2026, the largest fall since the start of the year and mainly at smaller firms [18, 19]. The Financial Times reported vacancies at their lowest since the Covid-era lockdowns [20]; the unemployment rate fell by 0.1 points to 4.7% in June to August [19], which the Guardian called a surprise drop [21].
- Germany. Registered unemployment fell by 40,000 to 2,955,000 in October (rate 6.3%), but rose by 4,000 after seasonal adjustment; 654,000 vacancies were registered with the Federal Employment Agency and its job index (BA-X) fell by 1 point to 102 [22]. Handelsblatt reported that the improving economy had not yet reached the labour market: the ifo employment barometer stood at 95.5 in October, its best value since summer 2024 but still below the level at which hiring and cutting plans balance [23].
- France. The ILO unemployment rate rose by 0.2 points to 8.3% in the second quarter of 2026 [24].
- Italy. Unemployment was 6.3% in September and the employment rate 63.0% [25].
- Greece. Unemployment was 7.6% in September, up from 7.4% in August and down from 8.8% a year earlier [26].
What researchers are saying #
Four strands of recent research bear on this month's data.
- Postings and vacancies. Matching near-universal online postings to JOLTS, Dalton, Kahn and Mueller find that postings converged towards official openings over 2007 to 2022 and capture large establishments well, but overstate employer concentration nearly threefold because small and mid-sized establishments post less online [27]. Abraham, Haltiwanger and Rendell show that vacancies per effective job seeker, counting employed and inactive searchers, explain inflation better in Phillips-curve equations than vacancies per unemployed person [28]. The New York Fed has tested LinkedIn's new tightness measures against JOLTS [29].
- AI and hiring. A 2025 World Bank study of 285 million US postings from 2018 to mid-2025 finds that postings for occupations with above-median exposure to substitution by generative AI fell by 12% relative to those below the median, and by 18% by the third year after ChatGPT's launch [30]. The August 2026 update of the Stanford study "Canaries in the Coal Mine?", as reported by Ars Technica, puts employment of 22 to 25 year olds in the most AI-exposed occupations 19% below that of their peers in less exposed fields [31]. Indeed counts 7.3% of US postings as AI-related [2].
- Pay transparency. US state laws requiring pay ranges in postings raised the share of postings with salary information by 30 percentage points and posted wages by 1.3% to 3.6%, with no effect on the number of postings [32]. In the EU, the deadline to transpose the Pay Transparency Directive passed on 7 June 2026 [33]: only four member states had met it by the deadline [34], seven of 27 had transposed it by late October according to Revelio Labs, and the share of EU postings that include a salary range, by Revelio Labs' measure, rose from 2.1% in January 2022 to 30.4% in August 2026 [35].
- Remote work and stale postings. Using a language model on nearly 600 million postings, Hansen and co-authors find that the share of US postings allowing remote work at least one day a week more than tripled between 2019 and 2026 [36]. Postings that stay up after the role is filled ("ghost" or phantom vacancies) remain a research and policy concern [37, 38].
4. The stock on 31 October: Europe and North America #
On 31 October 2026 JOA tracked 2,053,804 open postings located in Europe and North America: 1,505,926 in North America from 80,907 employers and 547,878 in Europe from 54,412. A further 299,042 are located in other countries and 150,534 have no resolved country.
| Region | Open postings | Employers | Own careers pages | Has posting date | Date > 90 days old | Pay in structured field | Work model in data | Top-10 employers share |
|---|---|---|---|---|---|---|---|---|
| Europe | 547,878 | 54,412 | 38% | 81% | 25.3% | 3.8% | 14.2% | 6.8% |
| North America | 1,505,926 | 80,907 | 30% | 84% | 20.2% | 7.9% | 9.7% | 6.3% |
| Other countries | 299,042 | 12,364 | 26% | 86% | 21.4% | 0.5% | 15.1% | 15.6% |
| Country not resolved | 150,534 | 13,475 | 24% | 68% | 15.0% | 0.8% | 14.9% | 7.9% |
Europe = EU27, EFTA (Switzerland, Norway, Iceland, Liechtenstein) and the United Kingdom; North America = United States and Canada. 'Date > 90 days old' is a share of postings with a posting date. Pay in a structured field is pay JOA detected in a dedicated data field, a lower bound for pay in the posting.
Europe #
Germany is the largest European market in the data with 193,604 open postings (35% of Europe), followed by the United Kingdom (90,175), France (65,715) and the Netherlands (41,271). French employers post the most roles each (16.9 open postings per employer, against 7.9 in Germany).
| Region or country | Open postings | Largest | Second | Third | Unclassified |
|---|---|---|---|---|---|
| Europe | 547,878 | Engineering (13.8%) | Operations & Admin (11.7%) | Skilled Technician (9.9%) | 6.1% |
| Germany | 193,604 | Skilled Technician (14.0%) | Healthcare (11.0%) | Engineering (10.4%) | 6.4% |
| United Kingdom | 90,175 | Operations & Admin (18.6%) | Engineering (13.6%) | Sales (8.1%) | 6.1% |
| France | 65,715 | Engineering (15.9%) | Operations & Admin (12.9%) | Skilled Technician (10.5%) | 4.0% |
| Netherlands | 41,271 | Operations & Admin (14.4%) | Skilled Technician (12.2%) | Engineering (11.0%) | 7.2% |
| Spain | 18,901 | Engineering (21.2%) | Sales (13.5%) | Operations & Admin (8.6%) | 6.2% |
| Italy | 14,324 | Sales (16.6%) | Engineering (14.8%) | Operations & Admin (10.9%) | 6.5% |
| Austria | 9,695 | Skilled Technician (13.2%) | Sales (12.1%) | Engineering (10.3%) | 5.8% |
Shares of postings with a role family, classified from the job title at confidence 0.6 or higher.
North America #
The United States accounts for 1,440,229 open postings from 78,383 employers (18.4 per employer) and Canada for 65,697 from 5,318 (12.4 per employer). Healthcare leads in the United States (22.2% of classified postings), followed by Operations & Admin (11.1%) and Sales (8.6%); in Canada, Operations & Admin (12.4%), Retail (12.3%) and Engineering (12.1%) are close together. 369,294 US postings carry no state.
Benchmark against official vacancy statistics #
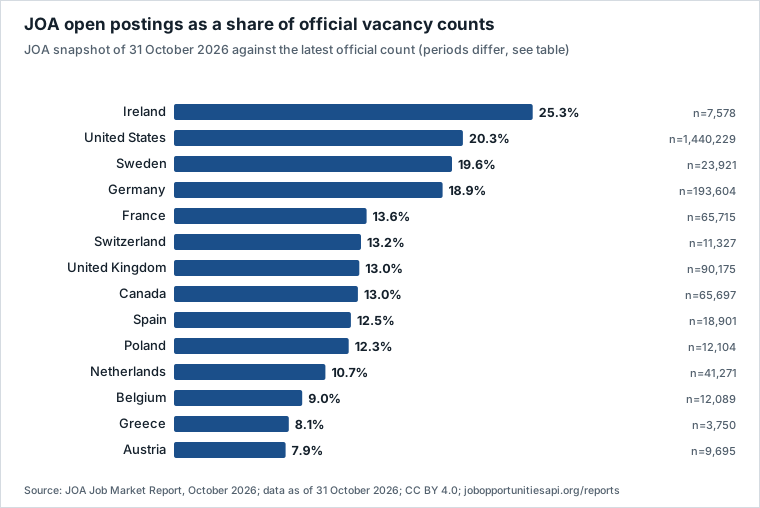
Official job vacancy statistics count vacancies at all employers through employer surveys; JOA counts the postings employers publish themselves. JOA's open postings are equivalent to 7.9% (Austria) to 25.3% (Ireland) of the official counts in 14 countries; the ratio compares two different counts and is not a coverage rate. Across US states, a state's share of JOA's US postings is a median 1.01 times its share of JOLTS job openings, ranging from 0.44 times (West Virginia) to 1.71 times (New Hampshire); the rank correlation, 0.97 across 51 jurisdictions (0.93 across the 14 countries), mainly reflects size. The JOLTS state values are for December 2025, the latest state figures the BLS had published by 1 November [39].
| Country | JOA open postings | Official vacancies | Official period | JOA as a share of official | Official measure and source |
|---|---|---|---|---|---|
| Ireland | 7,578 | 30,000 | Q2 2026 (prov.) | 25.3% | Eurostat job vacancies, provisional [40] |
| United States | 1,440,229 | 7,079,000 | Aug 2026 (prelim.) | 20.3% | JOLTS job openings, seasonally adjusted [6] |
| Sweden | 23,921 | 122,200 | Q2 2026 | 19.6% | Eurostat job vacancies [40] |
| Germany | 193,604 | 1,023,400 | Q2 2026 | 18.9% | IAB job vacancy survey [41] |
| France | 65,715 | 484,441 | Q2 2026 | 13.6% | DARES, all firm sizes, not seasonally adjusted [42] |
| Switzerland | 11,327 | 86,034 | Q4 2025 | 13.2% | Eurostat job vacancies (latest found) [40] |
| United Kingdom | 90,175 | 691,000 | Jul-Sep 2026 | 13.0% | ONS vacancies, 3-month average [18] |
| Canada | 65,697 | 507,200 | Aug 2026 | 13.0% | Statistics Canada job vacancies, seasonally adjusted [13] |
| Spain | 18,901 | 151,736 | Q2 2026 | 12.5% | INE vacancies [43] |
| Poland | 12,104 | 98,400 | Q2 2026 | 12.3% | Eurostat job vacancies [40] |
| Netherlands | 41,271 | 387,200 | Q2 2026 | 10.7% | Eurostat job vacancies [40] |
| Belgium | 12,089 | 133,881 | Q2 2026 | 9.0% | Eurostat job vacancies [40] |
| Greece | 3,750 | 46,368 | Q2 2026 | 8.1% | Eurostat job vacancies [40] |
| Austria | 9,695 | 123,400 | Q2 2026 | 7.9% | Statistik Austria open positions [44] |
JOA: snapshot of 31 October 2026. Official figures are survey-based counts of vacancies at all employers for the period shown. The ratios are higher than in September mainly because JOA's coverage grew (section 8), not because vacancies changed; Italy publishes a vacancy rate only (1.5% in Q2 2026) [45].
5. Pay transparency in Europe: the law, the evidence and JOA's postings #
Europe is in the middle of the largest change in pay transparency rules in its history. This section sets out where the EU Directive stands, what research found about earlier laws, and what JOA's own postings can and cannot add.
5.1 The EU Directive and where transposition stands #
The Pay Transparency Directive, (EU) 2023/970, gives job applicants the right to information on the initial pay or its range, for example in the job vacancy notice or before the job interview; it bars employers from asking applicants about their pay history; and it requires reports on the gender pay gap from employers with 250 workers or more every year from 7 June 2027, from those with 150 to 249 workers every three years from the same date, and from those with 100 to 149 workers every three years from 7 June 2031 [33]. Member states had to write it into national law by 7 June 2026. Some go further than the Directive and require the pay or range in the job advertisement itself.
| Member state | Status | Pay information at recruitment | Source |
|---|---|---|---|
| Slovakia | Act 76/2026 in force since 7 June 2026; first reports from 2027 | Starting pay or its range for applicants; no questions on pay history | [46, 47] |
| Italy | Legislative Decree 96/2026 of 7 May 2026, in force since 7 June 2026 | Initial pay or range in job notices and advertisements (Article 5) | [48, 47] |
| Malta | Legal Notice 173 of 2026, Gazette of 5 June 2026 | Initial pay or range before the start of employment | [49, 47] |
| Lithuania | Law XV-969 adopted 21 May 2026; most provisions from 7 June 2026 | Pay or range in the job advertisement (required since 2019) | [50, 47] |
| Greece | Law 5316/2026 in force 6 July 2026 [51]; main obligations stated to apply from 1 November 2026 [47] | As the Directive | [51, 47] |
| Poland | Partial: Labour Code amendment in force 24 December 2025 | Pay or range in the advertisement or before the interview; not required in the advertisement | [52, 53] |
| Czechia, Estonia | Partial transposition; remaining rules in draft | Czechia: none yet (bill); Estonia: before the interview, since 13 July 2026 | [47, 54] |
| Belgium | Public sector only (French and Flemish Communities); federal draft not published | None for private employers | [47, 55] |
| France, Netherlands, Spain, Finland, Denmark | Draft legislation; entry into force expected in 2027 or not yet known | France: in the advertisement or before the interview (draft) | [47] |
| Germany, Austria, Sweden | No law adopted; Germany has no draft, Austria's draft is in government coordination, Sweden has paused | None new | [47] |
| Bulgaria, Croatia, Cyprus, Hungary, Ireland, Latvia, Luxembourg, Portugal, Romania, Slovenia | Draft legislation or none yet; Ireland and Portugal have partial drafts | Varies; Latvia: pay in the advertisement since 2018 (national rule); Cyprus (draft): in writing before the interview | [47] |
Status as reported by Eversheds Sutherland's tracker of 28 September 2026, updated with the Deloitte Belgium tracker of 21 October 2026 [55], and confirmed against the national texts where linked; section 5.5 gives the status and dates for every country. By the deadline four member states had transposed in full [34]; Greece followed in July, and Revelio Labs counted seven of 27 with transposed law by late October, which probably includes partial measures [35].
5.2 What earlier laws did #
Several European countries tried versions of these rules before the Directive, and their effects have been measured. The evidence is mixed but points one way: pay in job ads raised starting pay in Slovakia and women's pay in Austria; pay gap reporting narrowed gaps in Denmark and the United Kingdom, mainly by slowing men's pay growth, but Austria's internal reports did not; and a right to request pay information had little effect except where works councils were present. Two kinds of rule should be kept apart: pay information in job advertisements, which reaches applicants before they apply, and reporting on internal pay gaps, which reaches employees and the public.
- Pay in job advertisements, Austria 2011. Since 2011 Austrian job adverts must include the minimum pay under the applicable collective agreement and any willingness to pay more [56]. Frimmel and co-authors find a small overall reduction in the gender wage gap, driven by higher earnings for women at the lower end of the distribution and largest where women had to decide quickly [57].
- Pay in job advertisements, Slovakia. In a working paper using a Slovak reform that made pay information in job ads mandatory, Škoda finds that wages of newly hired workers rose by about 3%, that ads from firms that began to include pay received more clicks and applications, and no evidence that the rule narrowed the gender pay gap [58].
- Internal pay reports, Austria 2011. The same Austrian reform required larger firms to produce internal gender pay reports; Gulyas, Seitz and Sinha find no discernible effect on men's or women's wages and rule out a narrowing of the gap by more than 0.4 percentage points [59].
- Gender-disaggregated wage statistics, Denmark 2006. Bennedsen, Simintzi, Tsoutsoura and Wolfenzon find that the gender pay gap narrowed by about two percentage points, 13% of its earlier level, mainly because men's wages grew more slowly; firm profitability was unaffected [60].
- Public gender pay gap reporting, United Kingdom 2017. Employers with 250 or more employees must publish their gender pay gap every year [61]. Blundell, Duchini, Simion and Turrell find that the rule closed 19% of the gap, again by slowing men's pay growth, most where public scrutiny was strongest [62].
- Right to request pay information, Germany 2018. The Pay Transparency Act lets employees of larger employers ask how colleagues in comparable jobs are paid [63]. Brütt and Yuan find no effect on wages or the gender gap [64]; Vaccaro and co-authors find a reduction only in establishments with a works council and a collective agreement [65].
- United States. State laws requiring pay ranges in postings raised the share of postings with pay by about 30 percentage points and posted wages by 1.3% to 3.6%, with no effect on the number of postings [32]; the Minneapolis Fed found rises of more than 50 points in the share of ads with pay in four early-law states (including Colorado, which section 5.4 leaves out because JOA has not verified its statute) against 27 points elsewhere [66]. A different kind of law, protecting workers' right to discuss pay with colleagues, was followed by wages about 2% lower, which Cullen and Pakzad-Hurson explain by employers bargaining harder [67].
Most of these studies measure effects on wages and gender gaps, not on how many postings include pay; the US studies are the exception.
5.3 What JOA detected: Austria and Germany #
JOA detected a pay figure in 44.4% of Austrian and 5.8% of German open postings on 31 October, a ratio of 7.6 to 1. These are lower bounds: in the September edition, a blind, AI-assisted reading of sampled postings found a pay figure in an estimated 78% of Austrian and 18% of German postings, against 34% and 5% detected at the time.
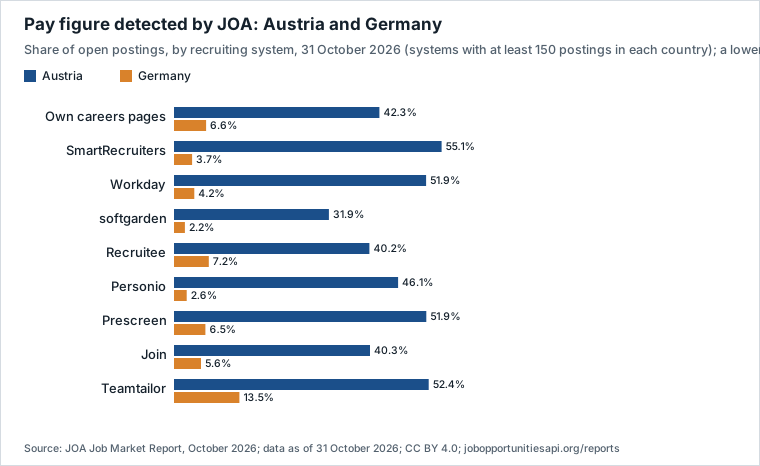
The gap holds within every recruiting system with at least 150 postings in each country: on employers' own careers pages JOA detected pay in 42.3% of Austrian and 6.6% of German postings, on SmartRecruiters in 55.1% and 3.7%, and on Workday in 51.9% and 4.2%. Because the comparison is made within the same systems, it does not depend on which systems each country's employers use. It is what Austria's 2011 rule would lead one to expect, but a cross-country gap cannot by itself show that the rule caused it.
5.4 US states with pay-range posting laws #
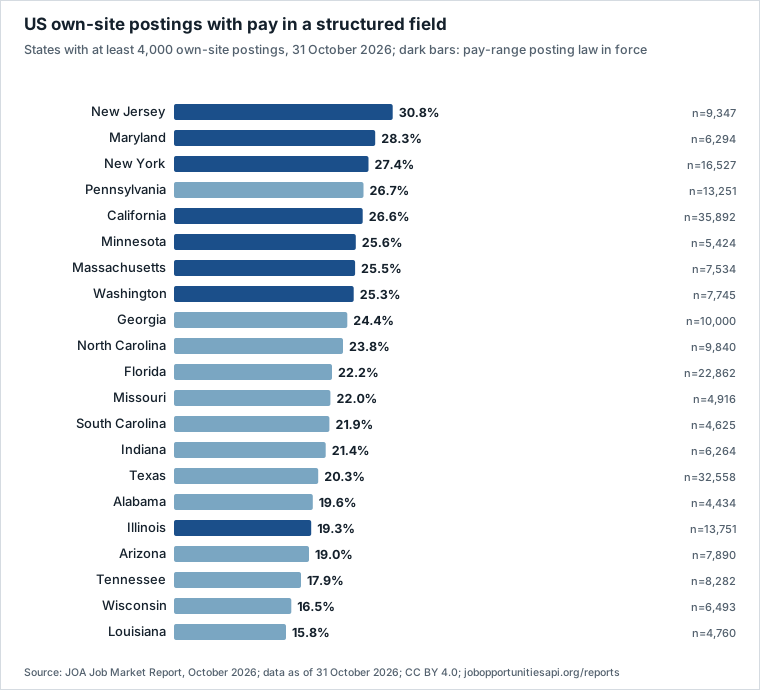
JOA has verified the statute in ten jurisdictions that require pay ranges in job postings: California, Illinois, Maryland, Massachusetts, Minnesota, New Jersey, New York, Vermont, Washington and the District of Columbia [68, 69, 70, 71, 72, 73, 74, 75, 76, 77]. Thirteen states where the rule is unconfirmed or applies only on request, including Colorado and Hawaii, are left out of both groups, as in the September edition. On employers' own careers pages, JOA detected pay in a structured field in 26.0% of the 104,404 postings in these jurisdictions, against 21.2% of the 164,368 postings in the 28 comparison states. The difference is an association: the jurisdictions differ in other ways, and research on these laws finds that they raise the share of postings with pay by about 30 points [32].
5.5 Pay detected across Europe, and the rules behind it #
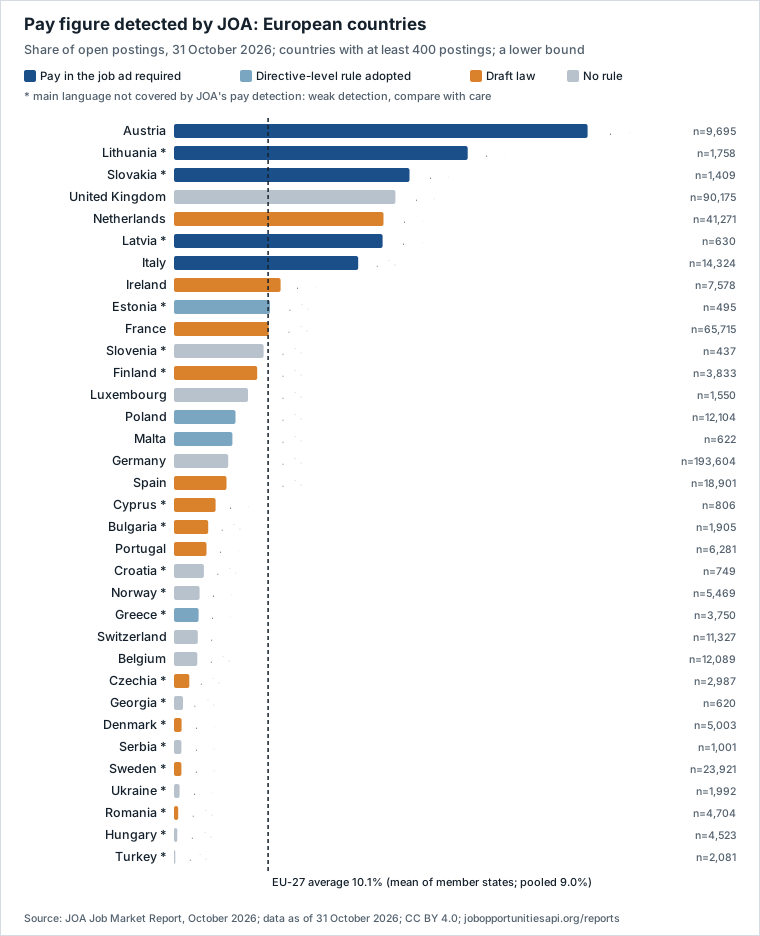
JOA detected a pay figure in 10.1% of open postings in the average EU member state on 31 October, and in 9.0% of all EU-27 postings taken together. The text uses the first figure, the simple mean of the 27 member states, because the question is how national rules relate to pay in postings and each member state has one set of rules; the pooled figure gives Germany, with 43.9% of the EU-27's open postings in JOA's data, almost half the weight. The measure and the population are those of section 5.3: open postings on 31 October in which JOA detected a pay figure, in a structured field or in the text, a lower bound. The table covers every European country with at least 400 open postings.
| Country | Open postings | Pay detected | Adjusted for systems | English postings | Detection | Rule on 31 October |
|---|---|---|---|---|---|---|
| Austria | 9,695 | 44.4% | 43.0% | 38.4% | Validated | In the ad, since 2011 |
| Lithuania | 1,758 | 31.5% | 32.5% | 55.5% | Weak: Lithuanian 41%, 3.0% | In the ad, since 2019 |
| Slovakia | 1,409 | 25.3% | 25.5% | 40.0% | Weak: Slovak 24%, 5.2% | In the ad, since 2018 |
| United Kingdom | 90,175 | 23.8% | 23.7% | 24.4% | Covered | None (consultation) |
| Netherlands | 41,271 | 22.5% | 19.3% | 13.3% | Covered | None; draft |
| Latvia | 630 | 22.4% | 22.5% | 37.7% | Weak: Latvian 41%, 3.9% | In the ad, since 2018 |
| Italy | 14,324 | 19.8% | 20.1% | 26.7% | Covered | In the ad, since June 2026 |
| Ireland | 7,578 | 11.4% | 12.1% | 12.5% | Covered | None; draft |
| Estonia | 495 | 10.3% | 10.4% | 16.4% | Weak: Estonian 32%, 0.6% | Before interview, since July 2026 |
| France | 65,715 | 10.2% | 9.1% | 6.2% | Covered | None; draft |
| Slovenia | 437 | 9.6% | 9.6% | 6.4% | Weak: Slovenian | None |
| Finland | 3,833 | 8.9% | 8.6% | 7.7% | Weak: Finnish 49%, 11.1% | None; draft |
| Luxembourg | 1,550 | 7.9% | 8.1% | 10.8% | Covered | None |
| Poland | 12,104 | 6.6% | 6.7% | 7.1% | Covered | Before interview, since December 2025 |
| Malta | 622 | 6.3% | 6.9% | 6.5% | Covered | Before employment, since June 2026 |
| Germany | 193,604 | 5.8% | 6.0% | 4.6% | Validated | None |
| Spain | 18,901 | 5.6% | 5.8% | 6.1% | Covered | None; draft |
| Cyprus | 806 | 4.5% | 4.6% | 4.9% | Weak: Greek | None; draft |
| Bulgaria | 1,905 | 3.7% | 3.8% | 4.3% | Weak: Bulgarian 12%, 0.4% | None; draft |
| Portugal | 6,281 | 3.5% | 3.6% | 5.3% | Covered | None; draft |
| Croatia | 749 | 3.2% | 3.1% | 4.8% | Weak: Croatian | None |
| Norway | 5,469 | 2.7% | 2.6% | 3.7% | Weak: kroner 17%, 0.0% | None (EEA pending) |
| Greece | 3,750 | 2.6% | 3.3% | 3.6% | Weak: Greek 30%, 0.5% | Before interview, from 1 November 2026 |
| Switzerland | 11,327 | 2.6% | 2.5% | 1.8% | Covered | None |
| Belgium | 12,089 | 2.5% | 2.3% | 3.5% | Covered | None |
| Czechia | 2,987 | 1.6% | 1.7% | 1.5% | Weak: Czech 30%, 1.8% | None; draft |
| Georgia | 620 | 1.0% | 1.0% | 1.3% | Weak: Georgian 12%, 0.0% | None identified |
| Denmark | 5,003 | 0.8% | 0.8% | 1.9% | Weak: kroner 49%, 0.0% | None; draft |
| Serbia | 1,001 | 0.8% | 0.8% | 1.0% | Weak: Serbian | None identified |
| Sweden | 23,921 | 0.8% | 1.1% | 2.0% | Weak: kroner 77%, 0.1% | None; draft |
| Ukraine | 1,992 | 0.6% | 0.6% | 1.2% | Weak: Ukrainian 40%, 1.4% | None identified |
| Romania | 4,704 | 0.4% | 0.4% | 0.4% | Weak: Romanian 10%, 0.2% | None; draft |
| Hungary | 4,523 | 0.4% | 0.3% | 0.4% | Weak: Hungarian 29%, 0.0% | None |
| Turkey | 2,081 | 0.1% | 0.1% | 0.3% | Weak: Turkish 16%, 0.0% | None identified |
| EU-27, mean of states | 27 countries | 10.1% | Each member state counts once | |||
| EU-27, pooled | 440,644 | 9.0% | All EU-27 postings together |
Pay detected is a lower bound. Adjusted for systems: each recruiting system is given the detected rate it has across the EU-27, so that a country does not rank higher only because its employers use systems with better detection. English postings: share of English-language postings with a pay figure detected, from JOA's live database on 1 November, which holds the language of the posting constant. Detection: validated (checked against a blind reading of postings, section 5.3), covered (the main language is in JOA's pay rules but has not been checked) or weak (the main language is not covered; where JOA tags enough postings in it, the share of postings in that language and the share of them with pay detected follow; for Sweden, Denmark and Norway the gap is that amounts in kroner are not read). Rule on 31 October: what employers must do about pay at recruitment; details, dates and sources in the second table. Countries with fewer than 400 open postings are left out: Russia (253), Liechtenstein (190), Montenegro (137), Bosnia and Herzegovina (136), North Macedonia (135), Albania (124), Moldova (118), Kosovo (104), Iceland (73) and Belarus (40).
- Where the rules stand. Four countries required pay in job advertisements well before the Directive: Austria since 2011, Slovakia and Latvia since 2018 and Lithuania since 2019 [56, 78, 79, 80]. Italy added the same requirement when it transposed the Directive in June 2026 [48]. Poland, Malta and Estonia have rules at the Directive's level, pay before the interview or before employment starts, which do not require pay in the advertisement itself; Greece's law applies from 1 November, the day after this snapshot. Twelve member states have published drafts and six have no rule for private employers and no published draft.
- Countries with an ad rule lead. The four countries with a long-standing ad rule average 30.9%, three times the EU-27 average, and Italy, five months into its rule, is at 19.8%. Countries whose rule stops at the Directive's minimum average 6.5%, those with only a draft 6.2%, and the 13 countries with no rule, the United Kingdom and Switzerland among them, 4.7%.
- The ranking is not an effect of recruiting systems. Adjusting for each country's mix of systems moves the Netherlands most, from 22.5% to 19.3%, and leaves the order of the 21 countries with at least 2,000 postings practically unchanged (rank correlation 1.00). On employers' own careers pages alone, Austria is at 42.3% and Germany at 6.6%, as in section 5.3.
- Detection limits the reading, in both directions. JOA's text rules do not cover Lithuanian, Slovak or Latvian, and in postings written in those languages JOA detected pay in 3.0%, 5.2% and 3.9% of cases. These countries' high shares come from postings in English, where JOA detected pay in 55.5% in Lithuania, 40.0% in Slovakia and 37.7% in Latvia, against 24.4% in the United Kingdom, so their true shares are probably well above the detected ones. With the language held constant, the order of countries is close to the overall one (rank correlation 0.97 across 34 countries). At the bottom of the table the low shares mostly reflect detection: JOA does not read amounts in kroner (Sweden, Denmark, Norway), and its rules do not cover Hungarian, Romanian, Czech, Greek, Bulgarian, Croatian or Finnish, nor the languages of the non-EU countries listed; only 0.1% of Swedish-language postings had a pay figure detected. Countries marked weak should not be compared with the others. The only check of JOA's detection against a reading of the postings is the September blind reading for Austria and Germany (section 5.3).
- An association, not an effect. The United Kingdom (23.8%) and the Netherlands (22.5%) have high detected shares without any duty to put pay in advertisements, so rules are not the only reason employers include pay. Countries that legislated early may also be those where pay in ads was already common, and the countries differ in language, sectors and the employers JOA covers. Studies that compare the same labour markets before and after a rule, in Slovakia and in US states, find that ad rules raised the share of ads with pay [58, 32]; this cross-country table cannot show that by itself.
- What to watch. Greece's rules apply from 1 November 2026; Czechia expects its rules on 1 January 2027 and Poland its remaining rules by the same date, Finland is expected to follow on that date although its bill leaves the date open, and Denmark expects 1 March 2027; the other member states without a law have announced no date. Italy is the first test of a new ad rule, applied since 7 June 2026. Once pay detection covers these countries' languages and has been checked against a reading of the postings, the fixed panel can follow the same employers' postings before and after each date, with detection held fixed (section 5.6).
| Country | Rule before the Directive | Directive (EU) 2023/970: law adopted, applies, or expected | Pay information at recruitment | Sources |
|---|---|---|---|---|
| Austria | Since 1 March 2011: minimum pay under the collective agreement and any willingness to pay more in every job advert (Equal Treatment Act, section 9) | No federal law; draft in government coordination since 6 June 2026; date not known. Regional rules for some Land public services only (Lower Austria since 4 June 2026) | Pay in the advertisement (2011 rule) | [56, 47, 55] |
| Belgium | None for private employers | Public sector only: French Community since 1 January 2025, Flemish Community since June 2026; federal draft not published; date not known | None for private employers today | [47, 55] |
| Bulgaria | None found | Bill before the National Assembly since September 2026; date not known (draft reporting from 7 June 2027) | Draft: initial pay to applicants, no deadline and no job ad duty | [47, 55, 81] |
| Croatia | None | No published text; ministry preparing Labour Act amendments (13 October 2026); date not known | None today | [47, 55] |
| Cyprus | None found | Bill finalised after consultation, not yet tabled; date not known | Draft: in writing before the interview | [47, 55] |
| Czechia | None on pay at recruitment (pay secrecy rules since 1 June 2025) | Bill in parliament (first reading 20 October 2026); recruitment duty expected 1 January 2027 | Draft: minimum pay to applicants before the employment relationship | [47, 55] |
| Denmark | None | Bill L68 introduced 8 October 2026; expected 1 March 2027 | Draft: as the Directive | [47, 82, 55] |
| Estonia | None before 2026 | Recruitment rules adopted 17 June 2026, in force 13 July 2026 (partial transposition); rest date not known | Pay or range in writing before the interview, in the advert or otherwise | [54, 47] |
| Finland | None | Bill in parliament since 9 July 2026; expected 1 January 2027 (Eversheds), the bill itself leaves the date blank | Draft: as the Directive | [47, 55] |
| France | None | Bill in the Senate since 10 September 2026; applies by decree within a year of promulgation; date not known | Draft: in the advertisement or before the interview (trackers differ on the advert) | [47, 55] |
| Germany | None (2017 Pay Transparency Act gives employees a right to request pay information, nothing at recruitment) | No draft published; date not known | None today | [63, 47, 55] |
| Greece | None | Law 5316/2026 in force 6 July 2026; recruitment and other main duties apply from 1 November 2026 | Pay or range, written or oral, before the interview | [51, 83, 47] |
| Hungary | None | No published text; date not known | None today | [47, 55] |
| Ireland | None (gender pay gap reporting only) | Partial draft (Equality (Miscellaneous Provisions) Bill 2024); Pay Transparency Bill heads in preparation; date not known | Draft: salary or range in the advertisement | [47, 55] |
| Italy | None | Legislative Decree 96/2026 of 7 May 2026, in force 7 June 2026 | Initial pay or range in job notices and advertisements (Article 5) | [48, 47] |
| Latvia | Since 28 November 2018: gross monthly or annual pay or hourly range in every job advert (Labour Law, section 32, amended 1 November 2018) | Draft law (March 2026), not yet before the Cabinet; date not known | Pay in the advertisement (2018 rule; the draft keeps it) | [79, 84, 55] |
| Lithuania | Since 27 July 2019: base pay or range in every job advert (Labour Code, article 25, Law XIII-2327) | Law XV-969 adopted 21 May 2026, most provisions in force 7 June 2026 | Pay or range in the advertisement (2019 rule) | [80, 50, 47] |
| Luxembourg | None | No bill deposited; date not known | None today | [47, 55] |
| Malta | None | Legal Notice 173 of 2026, Gazette of 5 June 2026, in force | Initial pay or range before the start of employment | [49, 47] |
| Netherlands | None | Bill in parliament (plenary debate set for 7 December 2026); date not known | Draft: employer chooses when and how | [47, 55] |
| Poland | None before 2025 | Recruitment rules in force 24 December 2025 (partial); remaining rules expected 1 January 2027 | Pay or range in the advert or before the interview | [52, 53, 47] |
| Portugal | None | Draft published August 2026; date not known | Draft: partial transposition | [47, 55] |
| Romania | None | Bill rejected by the Senate 14 October 2026, now before the Chamber of Deputies; date not known | Draft: pay or range before the interview | [47, 55] |
| Slovakia | Since 1 May 2018: basic wage component in every job offer (Employment Services Act, section 62) | Act 76/2026 adopted 15 April 2026, in force 7 June 2026 | Pay in the job offer (2018 rule) plus starting pay or range for applicants | [78, 46, 47] |
| Slovenia | None | Draft with the social partners since February 2026, not published; date not known | None today | [47, 55] |
| Spain | None | Draft Royal Decree (consultation to 24 August 2026); date not known | Draft has no recruitment rule | [47, 55] |
| Sweden | None | Drafted bill (15 January 2026) paused by the government; date not known | Draft: as the Directive | [47, 55] |
| Country | Rule before the Directive | Directive (EU) 2023/970: law adopted, applies, or expected | Pay information at recruitment | Sources |
|---|---|---|---|---|
| Iceland | None | EEA: Directive under scrutiny for incorporation into the EEA Agreement; date not known | None today | [85] |
| Liechtenstein | None | EEA: Directive under scrutiny for incorporation into the EEA Agreement; date not known | None today | [85] |
| Norway | None | EEA: Directive under scrutiny for incorporation into the EEA Agreement; date not known | None today | [85] |
| Switzerland | None (equal pay analysis for employers with 100 or more staff) | Not in the EU or EEA | None | [86] |
| United Kingdom | None (gender pay gap reporting since 2017) | Not in the EU; government consultation (July 2026) proposes pay in adverts or before the interview | None today | [87, 61] |
| Serbia | None identified (not verified) | Not in the EU or EEA | None identified | Not checked |
| Turkey | None identified (not verified) | Not in the EU or EEA | None identified | Not checked |
| Ukraine | None identified (not verified) | Not in the EU or EEA | None identified | Not checked |
| Georgia | None identified (not verified) | Not in the EU or EEA | None identified | Not checked |
Dates come from the national texts where linked, and otherwise from the Eversheds Sutherland tracker of 28 September 2026, its latest public country table, and the Deloitte Belgium tracker last updated 21 October 2026, which agree on the dates given here. Expected dates are those set in a bill or announced by the government as reported by these trackers; they are not law. Of the 27 member states, seven have adopted a law with a known date (five in full, Poland and Estonia in part), three have an expected date and 17 have no date announced. For Iceland, Liechtenstein and Norway the Directive is still under scrutiny for incorporation into the EEA Agreement [85].
5.6 What JOA's data can and cannot show about the Directive #
- Pay shares are what JOA detected. Every pay figure in this report is what JOA's automated reading found, a lower bound for the pay that postings contain, and detection differs by language and recruiting system.
- No month-on-month change this edition. JOA extended pay detection to more languages during September and October (section 8), so a rise in detected pay would mostly measure JOA's reading, not employers' behaviour.
- Too early and too few postings for the new laws. The five countries that transposed in full account for a small part of JOA's data (14,324 open postings in Italy, 3,750 in Greece, 1,758 in Lithuania, 1,409 in Slovakia and 622 in Malta), and in Greece the main obligations started only on 1 November.
- What JOA can do next. Once detection is stable, the fixed panel can follow the same employers' postings before and after national rules take effect, in transposing and non-transposing countries, which is the comparison the studies above use.
6. Hiring dynamics #
Age of posting dates #
For postings with a posting date, the chart shows the share whose date is more than 90 days old. Each recruiting system defines that date (first publication, last update or start date), so the figure describes the date as each system records it.
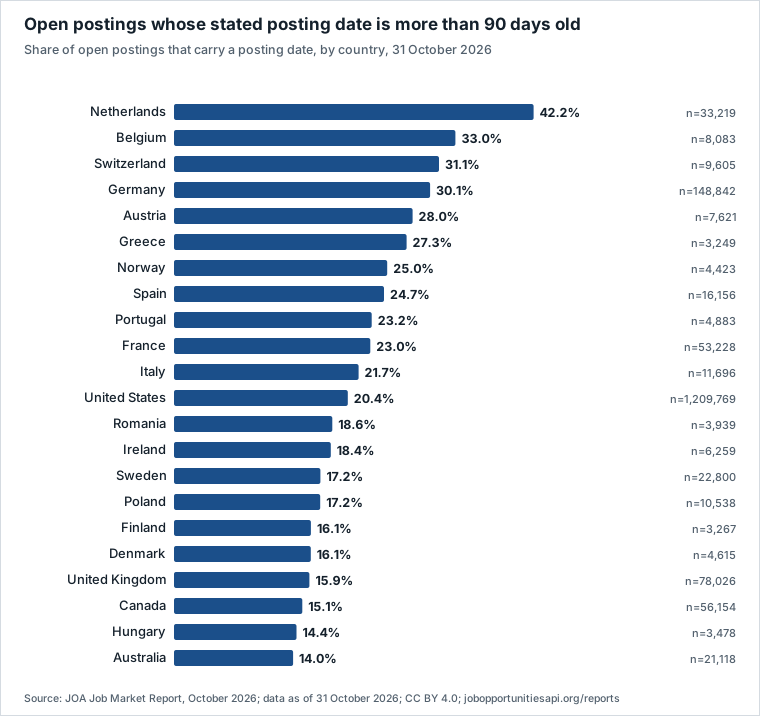
The Netherlands (42.2%), Belgium (33.0%) and Switzerland (31.1%) have the highest shares and Canada (15.1%) and Hungary (14.4%) the lowest, with Australia at 14.0%. By recruiting system, the share ranges from 2.2% on the UK's Teaching Vacancies service and 3.8% on SmartRecruiters to 53.2% on Personio, so part of a country's figure reflects its mix of systems. An old posting date can mark an evergreen posting, a re-used template or a long search; research on phantom vacancies explains why old listings are less likely to be live [37]. Since October, JOA's served data also hold back postings that its checks flag as stale, so the shares are likely lower than they would otherwise be and are not compared with September's.
Concentration among employers #
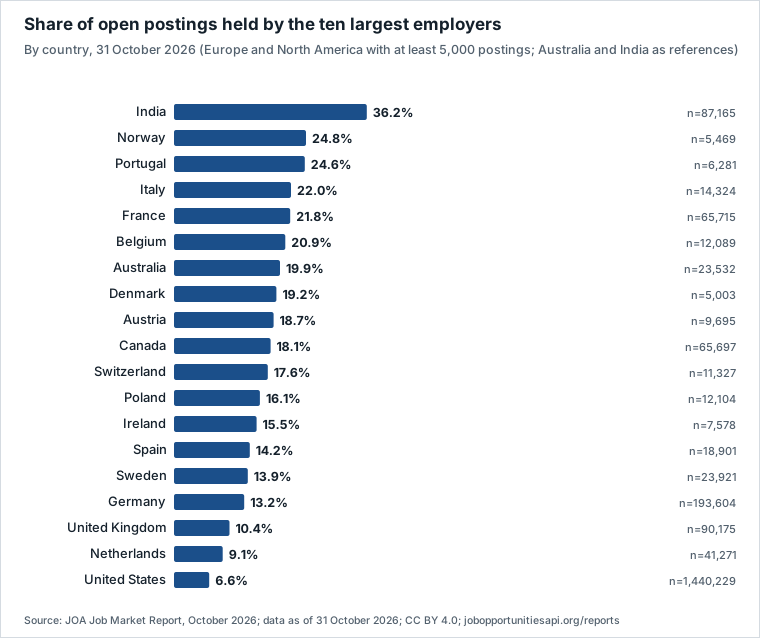
The ten employers with the most postings hold 24.8% of Norway's and 24.6% of Portugal's postings, against 9.1% in the Netherlands and 6.6% in the United States; India, shown as a reference, reaches 36.2%. Postings-based data overstate concentration because small employers post less online; one study puts the overstatement at nearly three times for a standard concentration index [27]. No employer is named in this report.
Work arrangement #
Countries are compared within one group of recruiting systems, Lever, Ashby and Join, in which most postings carry a work model in the posting data.
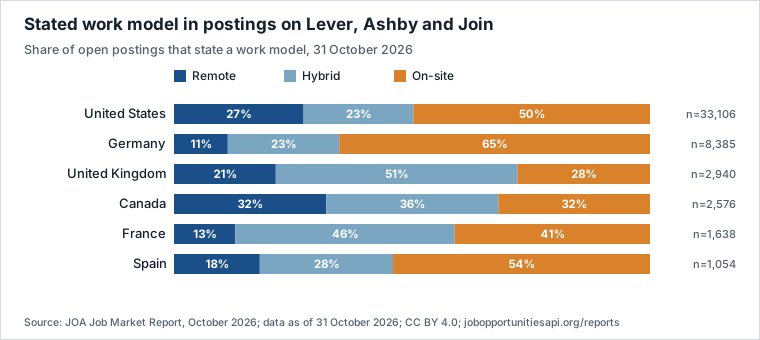
Hybrid leads in the United Kingdom (51%) and France (46%); on-site leads in Germany (65%), Spain (54%) and the United States (50%), where 27% of postings are remote; Canada splits almost evenly (remote 32%, hybrid 36%, on-site 32%). On SmartRecruiters, used heavily by large employers, on-site dominates everywhere:
| Country | Postings with a work model | Remote | Hybrid | On-site |
|---|---|---|---|---|
| United States | 23,171 | 7% | 11% | 82% |
| France | 8,795 | 2% | 18% | 80% |
| United Kingdom | 6,348 | 4% | 24% | 71% |
| Germany | 5,895 | 4% | 24% | 72% |
| Canada | 3,263 | 5% | 24% | 71% |
| Netherlands | 1,638 | 3% | 27% | 70% |
| Spain | 1,286 | 7% | 31% | 62% |
| Austria | 1,197 | 1% | 10% | 89% |
| Poland | 1,194 | 13% | 21% | 65% |
Posting days #
Of 1,375,128 postings dated in the four complete weeks from 28 September to 25 October, 5.6% are dated on a Saturday or Sunday. Posting dates are date-only and defined by each recruiting system.
7. Recruiting systems: who carries the postings #
Employers publish their jobs through recruiting software, and the market for those systems shapes what job seekers see and which postings any data source can collect. JOA records the system behind every posting it reads, which allows a view of the market by postings and by employers. The view is JOA's: it covers the systems JOA reads, and the share of each depends on how completely JOA reads it. Some large systems, notably SAP SuccessFactors, are not yet read directly; their employers' postings appear under own careers pages or not at all, which raises the shares of the systems JOA does read.
7.1 The snapshot on 31 October #
Of the 2,503,380 open postings, 30.7% come from employers' own careers pages, where JOA reads the page rather than a recruiting system and the system behind it is not identified, and 12,275 come from public employment service feeds. The remaining 1,723,658 postings, from 59,154 employer and system pairs, are on identified recruiting systems.
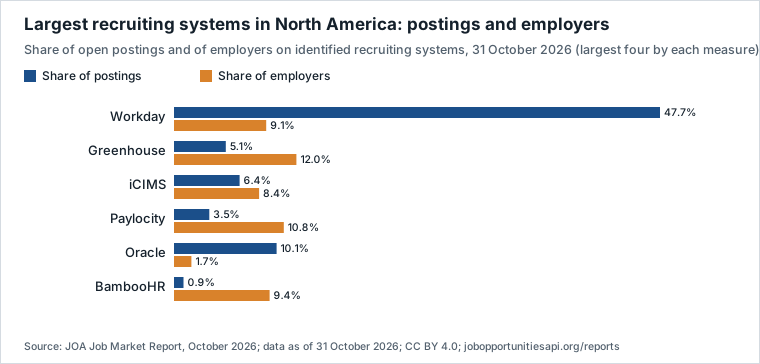
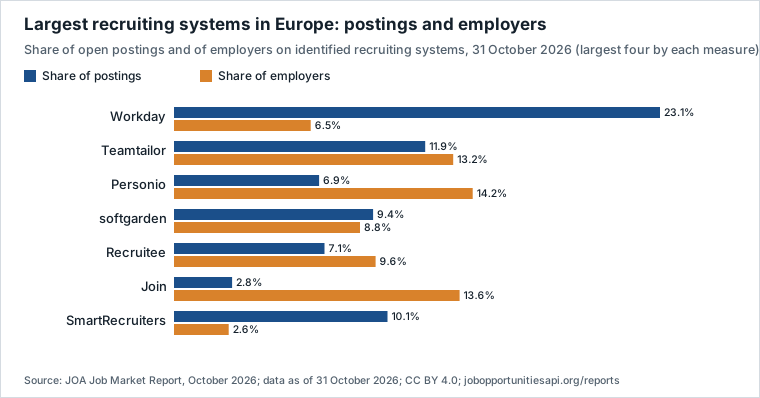
The two measures tell different stories. By postings, Workday dominates JOA's coverage: 47.7% of postings on identified systems in North America and 23.1% in Europe, followed in North America by Oracle (10.1%) and iCIMS (6.4%) and in Europe by Teamtailor (11.9%) and SmartRecruiters (10.1%). By employers, the market is fragmented: in North America Greenhouse (12.0%), Paylocity (10.8%), BambooHR (9.4%) and Workday (9.1%) are close together; in Europe Personio (14.2%), Join (13.6%) and Teamtailor (13.2%) lead. Workday's posting share reflects large employers with many openings each: its 3,225 North American employers carry 506,508 postings.
7.2 What changed since September, and what did not #
The shares by postings moved sharply between the two snapshots, but almost entirely because of JOA's coverage. In North America Workday's share of postings on identified systems fell from 52.7% on 4 October to 47.7%, as iCIMS (6.4%) and other systems JOA began to read in October entered the denominator. In Europe SmartRecruiters fell from 19.2% to 10.1%, as softgarden entered and as closures on SmartRecruiters were detected faster (section 8). These are changes in what JOA reads, not in the market, and are not published as a trend.
The robust view is a fixed panel of employers with open postings at both snapshots. In it, the number of employers on most large systems barely moved: Workday 3,756 and 3,757, Greenhouse 5,556 and 5,495, Teamtailor 2,880 and 3,026; SmartRecruiters fell from 1,502 to 1,279 as closures were detected faster. Postings on Workday in the same panel rose from 491,947 to 743,226 because JOA read Workday employers' boards more completely in October, which is why posting shares are not compared over time.
Switching is rare over one month. Of the 42,635 employers whose main source on 4 October was an identified recruiting system, 41,912 (98.3%) had the same main system on 31 October. Only 105 stopped posting on one established system and moved to another, and 118 changed their main system while still posting on both, too few, and too easily caused by changes in how JOA links company records, to read as a market trend. Across all 114,180 employers with postings at both snapshots, 3,912 moved to a system JOA began to read in October, which reflects JOA's coverage rather than a switch.
7.3 How this compares with other estimates #
Industry studies measure the market among the largest employers or across websites. Among the largest firms, where Workday is strongest, Jobscan's 2026 study of the Fortune 500 found that over 40% of the companies use Workday [88], and an October 2026 study of S&P 500 careers pages found Workday at 50% of the 474 companies whose system could be identified [89]. In Jobscan's wider sample of over 13,000 companies, Greenhouse (19.0%) leads Workday (17.5%), closer to JOA's view by employers [88]. Website technology surveys, which count sites rather than postings, put Personio at 53% of detected HR software on German websites and Teamtailor at 80.4% in Sweden [90, 91]. These are vendor-neutral but unaudited industry estimates with their own coverage limits; JOA's figures are shares of the postings and employers JOA reads.
8. What changed in JOA's data in October, and what is not compared #
JOA's pipeline changed a great deal in October. The changes below move JOA's counts without any change in the job market, so this edition does not compare them with September and measures change on the fixed panel instead.
- New sources. JOA began reading 45 recruiting systems and public sources during October, 31 of them from 30 October; together they account for 331,046 of the open postings on 31 October (222,632 in North America and 77,670 in Europe). Coverage of systems already read also deepened. The total therefore rose from 2,111,453 on 4 October to 2,503,380, Europe from 399,258 to 547,878 and North America from 986,641 to 1,505,926.
- Better location data. Postings without a resolved country fell from 560,385 to 150,534. Corrections were applied to open postings, so a closed September posting can carry an older location than an open October one; for Greenhouse, 59.6% of the panel's postings dated in September have no country against 22.2% of those dated in October. Country-level levels are therefore not compared with September.
- Duplicate and quality holds. On 27 October JOA held back 372,688 postings collected more than once, and in October its checks began to hold back postings flagged as stale (110,900 on 29 October alone), as well as postings routed to agencies and job boards. These rules are applied retroactively to both months of the panel; they removed 0.34% of its September-dated and 0.25% of its October-dated postings (913 and 679), too few to move the comparison.
- Closure detection. JOA records a closure when its daily check finds that a posting has left the employer's system. The checker changed several times in October and was made much faster on 31 October, when 2,404 checks that had wrongly confirmed postings as live during a Workday maintenance window were withdrawn. On the fixed panel, the change in open postings between the two snapshots ranges from -29.6% on SmartRecruiters to +51.0% on Workday, which reflects closure detection and coverage, not hiring. Closures, time to close and net stock change are therefore not published.
- Pay detection. JOA extended pay detection to more languages during September and October: among SmartRecruiters postings first seen in the week of 31 August, 2.4% had a pay figure read from the text, against 20.2% in the week of 26 October. Pay shares are not compared month on month.
- Role families. The share of unclassified postings is 10.7% among panel postings dated in September that have since closed and 5.6% among those dated in October, because classification improved during the period. Role-family shares are not compared month on month.
- Systems left out of the panel. Workday, Oracle and employers' own careers pages are left out of the trend because their posting dates and coverage changed during the two months; on the same panel rules, their October postings would be +21.6% (Workday) and -11.9% (own careers pages) against September, and all systems together +6.6%.
9. Methodology #
Data and population #
All figures come from one consistent read-only snapshot of the JOA database taken at 23:39 UTC on 31 October 2026. The population is the set of postings JOA's API serves to its customers: postings found live at an employer's own recruiting system or careers page (plus a small number from public employment service feeds), not opted out by the employer and passing JOA's quality checks; postings collected more than once and re-posts whose title begins 'Copy of' are held back. 2,503,380 open postings from 137,090 employer records were analysed, the same count JOA's API served at that moment.
The fixed panel #
The panel consists of employer and recruiting-system pairs that JOA first saw before 31 August 2026 and that had at least one open posting both at the September snapshot (04:03 UTC on 4 October) and at this one: 18,813 pairs, of which 15,369 posted at least once in the two windows. Requiring open postings on 31 October uses information from October and can bias the change upward, because employers that stopped posting drop out; the wider panel, which keeps every pair open on 4 October (21,721) with its actual October postings, lowers the seven-system change from +1.7% to +0.9%. Some pairs leave because JOA stopped reading them rather than because the employer stopped hiring, so the true change probably lies between the two. Both snapshots are rebuilt from the same current records, so later corrections (holds, locations, company names) apply equally to both months. The September stock is rebuilt from the dates on which postings closed or were held back. The panel counts every posting with a posting date in the two windows, including postings that have since closed, and is limited to seven systems whose posting dates are captured within two days of the date for most postings (between 83% and 100% in both months). Being fixed, it covers established employers only; the main panel does not count employers new to JOA or employers that stopped posting.
The 95% intervals allow for the fact that one employer's postings move together. With S and O an employer's September and October postings and R = sum(O) / sum(S), the standard error of R is the square root of n/(n-1) times the sum over employers of (O minus R times S) squared, divided by sum(S); the interval is R plus or minus 1.96 standard errors. The intervals reflect variation across employers, not common shocks or changes in how systems date postings; a change whose interval excludes zero is described as a movement, with the caution that one in twenty such tests crosses by chance.
Measures #
- Pay is read from structured fields of the source and from advert text, and is labelled 'inferred' in JOA's API when read from text. The report uses whether a pay figure is present, not its amount, and every pay share is what JOA detected, a lower bound for the pay that postings contain.
- Work model is counted only when it is in the posting data from the employer; JOA's inferred work model is not used.
- Role family is classified from the job title by JOA's model at confidence 0.6 or higher.
- AI-related titles match AI, A.I., LLM, GenAI or ML as words, or artificial intelligence, machine learning, generative, prompt engineer, deep learning or data science.
- Location comes from the source's location data and the posting's own page. The September edition measured that about 6% of German and Austrian postings in blind samples were located in another country than the one coded.
- Thresholds. A percentage is shown only if its base has at least 100 postings. Chart minimums are listed under each chart.
How JOA's data differ from official statistics and job boards #
Official vacancy statistics are employer surveys that count posts being filled by any channel, weighted to the whole economy and published with a lag [40, 39]. Job boards and aggregators collect postings from many intermediaries, so the same role can appear several times and the hiring employer may be hidden [92, 93]. JOA reads each posting at the employer's own system, with the employer's apply link, and re-checks it daily. Advert-based data in general over-represent higher-skilled occupations and large employers [94, 27]. JOA's levels therefore differ from official counts by design; what can be compared is structure and, as the record lengthens, change over time.
Reproducibility #
Every figure is computed by a script from the snapshot's aggregate tables, and an automated check matches each number in the text to a value in the data files or in the external sources listed in the references. The downloadable CSV holds every aggregate behind the charts and tables with its sample size, and the data dictionary defines each column.
10. Limitations and further research #
This section gathers in one place what JOA's data can and cannot support, so that readers can judge each finding.
10.1 Coverage and sampling #
- What JOA reads. JOA reads postings on the recruiting systems and careers pages it has connected; employers that hire only through agencies, job boards or word of mouth, and many small employers without a careers page, are outside it. Advert-based data in general over-represent large employers and higher-skilled occupations [94, 27].
- Country and system biases. 6.0% of open postings have no resolved country, and the share varies by recruiting system; JOA's postings are equivalent to between 7.9% and 25.3% of official vacancy counts across 14 countries, so its country mix differs from the economy's.
- October pipeline changes. New sources, location corrections applied to open postings, duplicate and stale holds, faster closure detection and wider pay detection all changed JOA's counts in October (section 8). Totals, closures and pay shares are therefore not compared with September.
- Closure detection. JOA re-checks served postings at their source every day; a posting can stay in the data for some hours after it closes, and the checker became much faster on 31 October.
- Pay. Pay shares are what JOA detected, a lower bound; the blind check in the September edition found pay in many more postings than were detected.
- One month of trend. The month-on-month comparison rests on one panel, one month and six or seven recruiting systems. It describes established employers on those systems; a second month is needed before calling a direction a trend.
10.2 What each finding can and cannot support #
| Finding | Can support | Cannot support |
|---|---|---|
| New postings flat (section 2) | That established employers on seven systems posted about as many roles in October as in September | Statements about total hiring, vacancies or employment |
| North America down, Europe up | A difference in direction between the two regions in the panel | The size of the change in each economy |
| Country changes | Direction for the United States and the United Kingdom | Precise country rates, or changes for countries with small panels |
| Stock on 31 October | The structure of postings by country, role family, posting date and system | Levels or growth compared with September, or official vacancy levels |
| Pay detected, Austria against Germany and US law jurisdictions | That the gap exists within the same recruiting systems | The true share of postings with pay, or the effect of a law |
| Recruiting system shares | Which systems carry JOA's postings and employers | Market shares for all employers, or changes over time |
10.3 Open questions #
- Does the North American slowdown and the European rise last beyond one month, and do they show up in official vacancy statistics for the fourth quarter?
- Will national transposition of the Pay Transparency Directive raise the share of postings with pay, and starting pay, in transposing countries against non-transposing ones?
- How far do JOA's postings, which come only from employers' own systems, differ from job board data in level, mix and timing, and can they be weighted to official counts as researchers have done for US postings [27]?
- How long do roles stay open, by country and occupation, once a full month of faster closure detection is available?
- Are AI-related roles growing as a share of postings, and does that differ between JOA's titles and broader text-based measures?
10.4 Check our numbers and tell us #
We want this data checked. Every aggregate behind the charts and tables is in the CSV, with a data dictionary that defines each column; the postings themselves can be queried through JOA's API with a free key (jobopportunitiesapi.org/pricing). If a number does not reproduce, a comparison seems unfair or you disagree with a conclusion, write to [email protected] with the subject 'Market report correction'. Every correction will be checked, fixed on this page with its date, and listed in the next edition.
11. Next edition #
- Flows and duration. Closures and time to close on the fixed panel, once a full month of closure dates is recorded by the faster checker introduced on 31 October.
- A longer panel. November against October on the same panel rules, extended to recruiting systems whose posting dates have stabilised.
- Pay. Detection in more languages and a new blind check of detected against actual pay, so pay shares can be compared over time.
- Benchmarks. The September JOLTS, the October US jobs report and third-quarter European vacancy statistics.
12. About this report #
Cite as: Job Opportunities API (2026). JOA Job Market Report, October 2026 edition (snapshot of 31 October 2026). https://jobopportunitiesapi.org/reports/job-market-october-2026. Licensed under CC BY 4.0.
Licence. This report, its charts and its aggregate data are licensed under the Creative Commons Attribution 4.0 International licence (CC BY 4.0): share and adapt them, including commercially, with credit and a link to the report. Third-party figures quoted here (official statistics; Indeed Hiring Lab data, CC BY 4.0) remain under their publishers' terms.
Data downloads. The CSV and the data dictionary contain aggregates only, with no postings, employer names or personal data. Row-level postings are available through the JOA API (jobopportunitiesapi.org/pricing).
Corrections. To report an error, write to [email protected] with the subject 'Market report correction'. Each correction is checked, fixed on this page and listed below with its date.
Corrections log #
No corrections since publication.
13. AI disclosure #
This report was prepared with substantial help from AI, and readers should know how.
- Systems used. The analysis, the code and the draft were produced by an AI agent running Anthropic's Claude (model claude-opus-5-5) in the DeepSeek Harness agent environment. The two reviews of the draft, by an AI acting as a statistician and an AI acting as an editor, ran in a separate session of the same model, in three rounds. Web searches used the Exa search service and standard web fetching. No AI system was used as a source of facts, except the September edition's sampled estimate of pay in postings, an AI reading of postings that is labelled as such where it is quoted.
- What the AI did. It wrote the database queries and the analysis code (SQL and Go), computed the figures, drew the charts, searched for and read the official statistics, articles and studies cited, drafted the text and applied the reviewers' corrections. The September edition's estimate of how many postings contain pay, quoted in section 5, came from AI agents reading sampled postings blind to JOA's flags.
- How the work was checked. A program written by the AI agent matches every number in the text to a value in the data files or to a figure in a cited source; the AI agent fetched every reference and compared its claim with the source text on 1 November 2026, and the AI reviewers re-checked a sample of numbers and sources in each round. Charts, tables and the CSV are generated from the same data files.
- What people decided. Loukas (Luca) Tzekos chose the title, the framing and the date of publication, read the draft, asked for the sections on pay transparency laws, recruiting systems, limitations and this disclosure, and approved publication. He is editorially responsible for the report, including its errors.
Downloads
- Aggregate data (CSV, 4,012 rows) (CSV, 309 KB)Every aggregate behind the charts and tables, with sample sizes. No postings, employer names or personal data.
- Data dictionary (MD, 7 KB)Column definitions, sections, thresholds and licence.
- PDF edition (PDF, 447 KB)The full report for printing and offline reading: cover, contents, page numbers, charts and references.
- Citable record of the report and data tables (DOI, Zenodo) (doi.org)
References
- Indeed Hiring Lab. Job postings tracker data (aggregate_job_postings_<country>.csv; daily indexes to 23 October 2026), CC BY 4.0. https://github.com/hiring-lab/job_postings_tracker Accessed 1 November 2026.grey
- Indeed Hiring Lab. US Labor Market Snapshot, October 2026, 22 October 2026. https://hiringlab.indeed.com/2026/10/22/us-labor-market-snapshot-october-2026/ Accessed 1 November 2026.grey
- US Bureau of Labor Statistics. Schedule of releases for the Employment Situation (October 2026 data: 6 November 2026, 08:30 ET). https://www.bls.gov/schedule/news_release/empsit.htm Accessed 1 November 2026.official
- US Bureau of Labor Statistics. Total nonfarm employment (CES0000000001) and unemployment rate (LNS14000000), seasonally adjusted, September 2026 (preliminary), via the BLS public API v1. https://api.bls.gov/publicAPI/v1/timeseries/data/CES0000000001 Accessed 1 November 2026.official
- CNBC. Labor market faltered in September as jobs increased by just 29,000, unemployment rate rose to 4.2%, 2 October 2026. https://www.cnbc.com/2026/10/02/jobs-report-september-2026.html Accessed 1 November 2026.grey
- US Bureau of Labor Statistics. Job Openings and Labor Turnover Survey: job openings level, openings rate, hires rate and quits rate, total nonfarm, seasonally adjusted, August 2026 (preliminary; released 29 September 2026), via the BLS public API v1. https://api.bls.gov/publicAPI/v1/timeseries/data/JTS000000000000000JOL Accessed 1 November 2026.official
- Reuters. US job openings fall in August; layoffs remain low, 29 September 2026 (as published by Investing.com). https://www.investing.com/news/economic-indicators/us-job-openings-fall-in-august-layoffs-remain-low-4923025 Accessed 1 November 2026.grey
- Yahoo Finance. Job openings and hiring hold steady as 'low hire, low fire' market drags on, 29 September 2026. https://finance.yahoo.com/economy/article/job-openings-and-hiring-hold-steady-as-low-hire-low-fire-market-drags-on-143313164.html Accessed 1 November 2026.grey
- Board of Governors of the Federal Reserve System. Federal Reserve issues FOMC statement, 28 October 2026. https://www.federalreserve.gov/newsevents/pressreleases/monetary20261028a.htm Accessed 1 November 2026.official
- The Wall Street Journal. A Princeton Ph.D. applied to 2,300 jobs. He still can't get one, 17 October 2026. https://www.wsj.com/lifestyle/careers/labor-market-freeze-phd-graduate-f8e17d7c Accessed 1 November 2026.grey
- Statistics Canada. The Daily: Labour Force Survey, September 2026, 9 October 2026. https://www150.statcan.gc.ca/n1/daily-quotidien/261009/dq261009a-eng.htm Accessed 1 November 2026.official
- Reuters. Canada's employment unexpectedly shrinks in September, jobless rate inches up, 9 October 2026 (as published by Investing.com). https://www.investing.com/news/economy-news/canadas-employment-surprisingly-shrinks-in-september-jobless-rate-inches-up Accessed 1 November 2026.grey
- Statistics Canada. The Daily: Payroll employment, earnings and hours, and job vacancies, August 2026, 29 October 2026. https://www150.statcan.gc.ca/n1/daily-quotidien/261029/dq261029a-eng.htm Accessed 1 November 2026.official
- Eurostat. Euro area unemployment at 6.5%, EU at 6.2% (euro indicators, September 2026), 30 October 2026. https://ec.europa.eu/eurostat/en/web/products-euro-indicators/w/3-30102026-bp Accessed 1 November 2026.official
- Eurostat. Euro area job vacancy rate at 2.1% (euro indicators, second quarter 2026), 15 September 2026. https://ec.europa.eu/eurostat/en/web/products-euro-indicators/w/3-15092026-bp Accessed 1 November 2026.official
- European Central Bank. Monetary policy statement, press conference of 29 October 2026. https://www.ecb.europa.eu/press/press_conference/monetary-policy-statement/2026/html/ecb.is261029~5c5ffe99e5.en.html Accessed 1 November 2026.official
- Indeed Hiring Lab. European Labour Market Snapshot, October 2026, 26 October 2026. https://hiringlab.indeed.com/uk/blog/2026/10/26/european-labour-market-snapshot-october-2026/ Accessed 1 November 2026.grey
- UK Office for National Statistics. Vacancies and jobs in the UK: October 2026 (vacancies July to September 2026: 691,000). https://www.ons.gov.uk/employmentandlabourmarket/peopleinwork/employmentandemployeetypes/bulletins/jobsandvacanciesintheuk/october2026 Accessed 1 November 2026.official
- UK Office for National Statistics. Labour market overview, UK: October 2026. https://www.ons.gov.uk/employmentandlabourmarket/peopleinwork/employmentandemployeetypes/bulletins/uklabourmarket/october2026 Accessed 1 November 2026.official
- Financial Times. UK job vacancies slide over the summer, 20 October 2026. https://www.ft.com/content/2d20b09b-6565-4253-a809-8a0542e6770a Accessed 1 November 2026.grey
- The Guardian. Surprise drop in UK unemployment to 4.7% as John Healey's first budget looms, 20 October 2026. https://www.theguardian.com/business/2026/oct/20/uk-unemployment-rate-surprise-drop Accessed 1 November 2026.grey
- Bundesagentur fuer Arbeit (Federal Employment Agency, Germany). The labour market in October 2026, press release no. 41, 30 October 2026 (page in German, title translated). https://www.arbeitsagentur.de/presse/2026-41-arbeitsmarkt-im-oktober-2026 Accessed 1 November 2026.official
- Handelsblatt. Economy: upswing has not yet reached the labour market, 27 October 2026 (article in German, title translated). https://www.handelsblatt.com/politik/deutschland/konjunktur-aufschwung-kommt-bisher-nicht-am-arbeitsmarkt-an/100264886.html Accessed 1 November 2026.grey
- INSEE. In the second quarter of 2026 the unemployment rate rises by 0.2 points to 8.3%, Informations rapides no. 192, 7 August 2026 (page in French, title translated). https://www.insee.fr/fr/statistiques/9032359 Accessed 1 November 2026.official
- Istat. Employment and unemployment (provisional data), September 2026, 29 October 2026. https://www.istat.it/en/press-release/employment-and-unemployment-provisional-data-september-2026/ Accessed 1 November 2026.official
- eKathimerini. Jobless rate keeps declining (ELSTAT labour force survey, September 2026), 31 October 2026. https://www.ekathimerini.com/economy/1319854/jobless-rate-keeps-declining/ Accessed 1 November 2026.grey
- Dalton, M., Kahn, L. B. and Mueller, A. I. (2026). Do Online Job Postings Capture Job Vacancies? NBER Working Paper 35697. https://www.nber.org/papers/w35697 Accessed 1 November 2026.working-paper
- Abraham, K. G., Haltiwanger, J. C. and Rendell, L. E. (2026). Decomposing Shifts in the Beveridge Curve: Implications for Labor Market Dynamics and Inflation. NBER Working Paper 35316. https://www.nber.org/papers/w35316 Accessed 1 November 2026.working-paper
- Federal Reserve Bank of New York, Liberty Street Economics. Evaluating new LinkedIn labor market tightness indicators, 30 October 2026. https://libertystreeteconomics.newyorkfed.org/2026/10/evaluating-new-linkedin-labor-market-tightness-indicators/ Accessed 1 November 2026.grey
- World Bank (2025). Labor Demand in the Age of Generative AI: Early Evidence from the U.S. Job Posting Data. Policy Research Working Paper 11263. https://doi.org/10.1596/1813-9450-11263 Accessed 1 November 2026.working-paper
- Ars Technica. AI is hitting entry-level jobs hardest, Stanford study finds (on the August 2026 edition of 'Canaries in the Coal Mine? Six Facts about the Recent Employment Effects of Artificial Intelligence'), August 2026. https://arstechnica.com/ai/2026/08/ai-is-hitting-entry-level-jobs-hardest-stanford-study-finds/ Accessed 1 November 2026.grey
- Arnold, D., Quach, S. and Taska, B. (2025). The Impact of Pay Transparency in Job Postings on the Labor Market. NBER Working Paper 34480 (17 Nov 2025). DOI 10.3386/w34480. URL https://www.nber.org/papers/w34480 Accessed 1 November 2026.working-paper
- European Parliament and Council. Directive (EU) 2023/970 of 10 May 2023 to strengthen the application of the principle of equal pay for equal work or work of equal value between men and women through pay transparency and enforcement mechanisms (Arts 5, 7, 9, 34). EUR-Lex, CELEX 32023L0970. https://eur-lex.europa.eu/legal-content/EN/TXT/HTML/?uri=CELEX:32023L0970 Accessed 1 November 2026.official
- Deloitte Legal. EU Pay Transparency Directive: transposition update as of 12 October 2026, 15 October 2026. https://legalbriefs.deloitte.com/post/102o5k2/eu-pay-transparency-directive-transposition-update-as-of-12-october-2026 Accessed 1 November 2026.grey
- Revelio Labs. EU Pay Transparency Directive: who posts pay and why, 27 October 2026. https://www.reveliolabs.com/news/macro/eu-pay-transparency-directive-country-by-country Accessed 1 November 2026.grey
- Hansen, S., Lambert, P. J., Bloom, N., Davis, S. J., Muvdi, Y., Sadun, R. and Taska, B. (2026). Remote Work Across Jobs, Companies and Space. Federal Reserve Bank of Dallas Working Paper 2629, 19 August 2026. https://www.dallasfed.org/research/papers/2026/wp2629 Accessed 1 November 2026.working-paper
- Albrecht, J., Decreuse, B. and Vroman, S. (2020). Directed Search with Phantom Vacancies. IZA Discussion Paper No. 13704. URL https://hdl.handle.net/10419/227231 Accessed 1 November 2026.working-paper
- Ng, H. (2024). Why is it so hard to find a job now? Enter Ghost Jobs. arXiv:2410.21771 [econ.GN], submitted 29 Oct 2024. DOI 10.48550/arXiv.2410.21771. URL https://arxiv.org/abs/2410.21771 Accessed 1 November 2026.grey
- US Bureau of Labor Statistics. JOLTS state job openings, seasonally adjusted (series JTS000000{FIPS}0000000JOL), December 2025, the latest value returned by the BLS public API v1 on 1 November 2026. https://api.bls.gov/publicAPI/v1/timeseries/data/JTS000000060000000JOL Accessed 1 November 2026.official
- Eurostat. Job vacancy statistics, quarterly (dataset jvs_q_r21, NACE Rev. 2.1, updated 15 September 2026; CH from jvs_q_nace2, Q4 2025). https://ec.europa.eu/eurostat/api/dissemination/statistics/1.0/data/jvs_q_r21 Accessed 1 November 2026.official
- Institut fuer Arbeitsmarkt- und Berufsforschung (IAB). IAB-Stellenerhebung, second quarter 2026: about 1.02 million open positions. https://iab.de/presseinfo/iab-stellenerhebung-rueckgang-der-offenen-stellen-im-zweiten-quartal-2026-auf-rund-1-million/ Accessed 1 November 2026.official
- DARES (France). Emplois vacants, Q2 2026 (Acemo quarterly survey; all-size estimate and firms with 10+ employees). data.dares.travail-emploi.gouv.fr. https://data.dares.travail-emploi.gouv.fr Accessed 1 November 2026.official
- Instituto Nacional de Estadistica (Spain). Encuesta Trimestral de Coste Laboral, job vacancies, table 6047, Q2 2026. https://servicios.ine.es/wstempus/js/EN/DATOS_TABLA/6047 Accessed 1 November 2026.official
- Statistik Austria. Offene Stellen (job vacancies), Q2 2026. https://www.statistik.at/statistiken/arbeitsmarkt/arbeitskraeftenachfrage/offene-stellen Accessed 1 November 2026.official
- ISTAT. Il mercato del lavoro, II trimestre 2026 (job vacancy rate 1.5%; no vacancy count published). https://www.istat.it/comunicato-stampa/il-mercato-del-lavoro-ii-trimestre-2026/ Accessed 1 November 2026.official
- Slovakia. Act No. 76/2026 Coll. on equal pay for men and women for equal work or work of equal value, in force 7 June 2026. Slov-Lex (page in Slovak, title translated). https://www.slov-lex.sk/ezbierky/pravne-predpisy/SK/ZZ/2026/76/20260607 Accessed 1 November 2026.official
- Eversheds Sutherland. Snapshot update: EU Pay Transparency Directive, member state implementation table, 28 September 2026. https://www.eversheds-sutherland.com/en/lithuania/insights/eu-pay-transparency-directive-snapshot-update-september-2026 Accessed 1 November 2026.grey
- Italy. Legislative Decree of 7 May 2026, No. 96, implementing Directive (EU) 2023/970, Official Gazette of 1 June 2026. Normattiva (page in Italian, title translated). https://www.normattiva.it/eli/id/2026/06/01/26G00112/ORIGINAL Accessed 1 November 2026.official
- Malta. Legal Notice 173 of 2026, Equal Pay (Transparency and Reporting) Regulations, 2026, Government Gazette No. 21,661 of 5 June 2026. Laws of Malta. https://legislation.mt/eli/ln/2026/173/eng Accessed 1 November 2026.official
- Lithuania, Ministry of Social Security and Labour. Pay transparency increases, workers gain more rights (Labour Code amendments adopted by the Seimas), 21 May 2026 (page in Lithuanian, title translated). https://socmin.lrv.lt/lt/naujienos/didinamas-atlyginimu-skaidrumas-darbuotojams-daugiau-teisiu-P5p/ Accessed 1 November 2026.official
- Greece. Law 5316/2026 (Government Gazette A 105, 6 July 2026), strengthening equal pay between men and women and transposing Directive (EU) 2023/970. Text as published by the Forin legal database (page in Greek, title translated). https://www.forin.gr/laws/law/4570/n-5316-2026 Accessed 1 November 2026.official
- Poland. Act of 4 June 2025 amending the Labour Code, Journal of Laws 2025 item 807 (in force 24 December 2025). ELI (page in Polish, title translated). https://eli.gov.pl/eli/DU/2025/807/ogl/pol Accessed 1 November 2026.official
- Kochanski & Partners. New pay transparency rules are now in the Labour Code, 28 July 2025. https://www.kochanski.pl/en/new-pay-transparency-rules-are-now-in-the-labour-code/ Accessed 1 November 2026.grey
- Estonia, Ministry of Economic Affairs and Communications. Pay transparency (Employment Contracts Act amendments adopted 17 June 2026, in force 13 July 2026). https://www.mkm.ee/en/work-and-equal-opportunities/employment-relationships-and-work-environment/pay-transparency Accessed 1 November 2026.official
- Deloitte Belgium. EU Pay Transparency Directive Legal Tracker, last updated 21 October 2026. https://www.deloitte.com/be/en/services/tax/analysis/eu-pay-transparency-directive.html Accessed 1 November 2026.grey
- Austria. Gleichbehandlungsgesetz (GlBG), sections 9 and 10, consolidated version. Rechtsinformationssystem des Bundes (RIS). https://www.ris.bka.gv.at/GeltendeFassung.wxe?Abfrage=Bundesnormen&Gesetzesnummer=20003395 Accessed 1 November 2026.official
- Frimmel, W., Schmidpeter, B., Wiesinger, R. and Winter-Ebmer, R. (2023). External Pay Transparency and the Gender Wage Gap. IZA Discussion Paper 16233. https://docs.iza.org/dp16233.pdf Accessed 1 November 2026.working-paper
- Škoda, S. (2026). Directing Job Search in Practice: Mandating Pay Information in Job Ads. Working paper, University of Oslo, version of 16 October 2026. https://samuelskoda.github.io/skoda%5Fjmp.pdf Accessed 1 November 2026.working-paper
- Gulyas, A., Seitz, S. and Sinha, S. (2023). Does Pay Transparency Affect the Gender Wage Gap? Evidence from Austria. American Economic Journal: Economic Policy 15(2): 236-55. doi:10.1257/pol.20210128. https://www.aeaweb.org/articles?id=10.1257/pol.20210128 Accessed 1 November 2026.peer-reviewed
- Bennedsen, M., Simintzi, E., Tsoutsoura, M. and Wolfenzon, D. (2022). Do Firms Respond to Gender Pay Gap Transparency? Journal of Finance 77(4). doi:10.1111/jofi.13136 (NBER Working Paper 25435). https://www.nber.org/papers/w25435 Accessed 1 November 2026.peer-reviewed
- UK Government. Gender pay gap reporting: guidance for employers (updated 27 February 2023). GOV.UK. https://www.gov.uk/government/publications/gender-pay-gap-reporting-guidance-for-employers Accessed 1 November 2026.official
- Blundell, J., Duchini, E., Simion, Ş. and Turrell, A. (2025). Pay Transparency and Gender Equality. American Economic Journal: Economic Policy 17(2): 418-45. doi:10.1257/pol.20220766. https://www.aeaweb.org/articles?id=10.1257/pol.20220766 Accessed 1 November 2026.peer-reviewed
- Germany. Entgelttransparenzgesetz (EntgTranspG), sections 5 and 10. Gesetze im Internet. https://www.gesetze-im-internet.de/entgtranspg/index.html Accessed 1 November 2026.official
- Brütt, K. and Yuan, H. (2026). Transparency upon request: the right to pay information and the gender pay gap. Economica, published 28 April 2026. doi:10.1111/ecca.70051. https://doi.org/10.1111/ecca.70051 Accessed 1 November 2026.peer-reviewed
- Vaccaro, G., Wydra-Somaggio, G. and Homrighausen, P. (2024). Effectiveness of the German pay transparency law and the gender pay gap. German Journal of Human Resource Management 39(3): 248-278. doi:10.1177/23970022241280877. https://doi.org/10.1177/23970022241280877 Accessed 1 November 2026.peer-reviewed
- Federal Reserve Bank of Minneapolis. Pay transparency in job postings: trends, trade-offs, and policy design, 26 March 2024. https://www.minneapolisfed.org/article/2024/pay-transparency-in-job-postings-trends-trade-offs-and-policy-design Accessed 1 November 2026.grey
- Cullen, Z. B. and Pakzad-Hurson, B. (2023). Equilibrium Effects of Pay Transparency. Econometrica 91(3): 765-802. doi:10.3982/ECTA19788. https://www.econometricsociety.org/publications/econometrica/2023/05/01/Equilibrium-Effects-of-Pay-Transparency Accessed 1 November 2026.peer-reviewed
- California Labor Code section 432.3 (SB 1162, effective 1 January 2023). Legislative Information. https://leginfo.legislature.ca.gov/faces/codes_displaySection.xhtml?lawCode=LAB§ionNum=432.3 Accessed 1 November 2026.official
- Illinois Equal Pay Act of 2003, 820 ILCS 112/10(b-25) (P.A. 103-539, effective 1 January 2025). Illinois General Assembly. https://www.ilga.gov/legislation/ilcs/fulltext.asp?DocName=082001120K10 Accessed 1 November 2026.official
- Maryland Labor and Employment Article section 3-304.2 (HB 649 / SB 525 of 2024, effective 1 October 2024). Maryland General Assembly. https://mgaleg.maryland.gov/mgawebsite/Laws/StatuteText?article=gle§ion=3-304.2&enactments=false Accessed 1 November 2026.official
- Massachusetts General Laws c. 149 section 105F (Acts 2024, c. 141). Massachusetts Legislature. https://malegislature.gov/Laws/SessionLaws/Acts/2024/Chapter141 Accessed 1 November 2026.official
- Minnesota Statutes section 181.173 (2024 c. 110 art. 7, effective 1 January 2025). Office of the Revisor of Statutes. https://www.revisor.mn.gov/statutes/cite/181.173 Accessed 1 November 2026.official
- New Jersey N.J.S.A. 34:6B-23 (P.L. 2024, c. 91), in effect 1 June 2025. NJ Department of Labor. https://www.nj.gov/labor/myworkrights/wages/pay-transparency/ Accessed 1 November 2026.official
- New York Labor Law section 194-b (pay transparency), effective 17 September 2023. NYS Department of Labor. https://dol.ny.gov/pay-transparency Accessed 1 November 2026.official
- Vermont 21 V.S.A. section 495o (Act 155 of 2024, H.704), effective 1 July 2025. Vermont General Assembly. https://legislature.vermont.gov/bill/status/2024/H.704 Accessed 1 November 2026.official
- Revised Code of Washington 49.58.110 (effective 1 January 2023). Washington State Legislature. https://app.leg.wa.gov/RCW/default.aspx?cite=49.58.110 Accessed 1 November 2026.official
- District of Columbia Code section 32-1453.01 (D.C. Law 25-138, applicable from 30 June 2024). DC Council. https://code.dccouncil.gov/us/dc/council/code/sections/32-1453.01 Accessed 1 November 2026.official
- Slovakia, Ministry of Labour, Social Affairs and Family. New obligation when publishing a job offer (Employment Services Act section 62(2) and Labour Code section 41(10), in force 1 May 2018) (page in Slovak, title translated). https://www.employment.gov.sk/sk/praca-zamestnanost/nova-povinnost-pri-zverejnovani-ponuky-zamestnania.html Accessed 1 November 2026.official
- Latvia. Law of 1 November 2018 amending the Labour Law, official gazette Latvijas Vestnesis No 225, 14 November 2018 (page in Latvian, title translated). https://www.vestnesis.lv/op/2018/225.8 Accessed 1 November 2026.official
- Lithuania. Law No XIII-2327 amending articles 25 and 139 of the Labour Code, adopted 11 July 2019, published in the Register of Legal Acts 26 July 2019, in force 27 July 2019. Seimas legal acts register (page in Lithuanian, title translated). https://e-seimas.lrs.lt/portal/legalAct/lt/TAD/442d61f0a86c11e9aab6d8dd69c6da66 Accessed 1 November 2026.official
- Evenpay. Pay transparency legislation updates across the EU (entries to 28 October 2026). https://evenpay.io/pay-transparency-directive/updates/ Accessed 1 November 2026.grey
- Plesner. Draft bill implementing the EU Pay Transparency Directive introduced in the Danish Parliament, 15 October 2026. https://plesner.com/en/news/draft-bill-implementing-eu-pay-transparency-directive-introduced-danish-parliament Accessed 1 November 2026.grey
- Lewis Silkin. Greece transposes the EU Pay Transparency Directive: what employers need to know, 29 September 2026. https://www.lewissilkin.com/insights/2026/09/29/greece-transposes-the-eu-pay-transparency-directive-what-employers-need-to-know Accessed 1 November 2026.grey
- Latvia, State Labour Inspectorate. Content of job advertisement (Labour Law section 32), updated 22 October 2024. https://www.vdi.gov.lv/en/article/content-job-advertisement Accessed 1 November 2026.official
- European Free Trade Association, EEA-Lex. Factsheet 32023L0970: Directive (EU) 2023/970, under scrutiny for incorporation into the EEA Agreement by Iceland, Liechtenstein and Norway. https://www.efta.int/eea-lex/32023l0970 Accessed 1 November 2026.official
- Switzerland, Federal Office for Gender Equality. Promoting equal pay with Logib (equal pay analysis duty under the Gender Equality Act). https://www.ebg.admin.ch/en/equal-pay-logib Accessed 1 November 2026.official
- UK Government. Equal pay and pay discrimination: consultation, Annex A, full list of consultation questions (July 2026). https://www.gov.uk/government/consultations/equal-pay-and-pay-discrimination/annex-a-full-list-of-consultation-questions Accessed 1 November 2026.official
- Jobscan. 2026 Applicant Tracking System (ATS) Usage Report (Fortune 500), 20 August 2026. Industry estimate. https://www.jobscan.co/blog/fortune-500-use-applicant-tracking-systems/ Accessed 1 November 2026.grey
- Work Insiders (R. Bradshaw). Which ATS do S&P 500 companies use? 2026 market share study, 26 October 2026. Industry estimate. https://workinsiders.com/ats-market-share/ Accessed 1 November 2026.grey
- Wmtips. Top HR management software on the web in Germany by market share (2026), website technology survey. Industry estimate. https://www.wmtips.com/technologies/hr-management/country/de/ Accessed 1 November 2026.grey
- Wmtips. Top HR management software on the web in Sweden by market share (2026), website technology survey. Industry estimate. https://www.wmtips.com/technologies/hr-management/country/se/ Accessed 1 November 2026.grey
- Cedefop (2019). Online job vacancies and skills analysis: a Cedefop pan-European approach. Luxembourg: Publications Office of the European Union. https://www.cedefop.europa.eu/files/4172_en.pdf (doi 10.2801/097022 as printed in the report) Accessed 1 November 2026.grey
- Carnevale, A. P., Jayasundera, T. and Repnikov, D. (2014). Understanding Online Job Ads Data: A Technical Report. Georgetown University Center on Education and the Workforce, April 2014. URL https://cew.georgetown.edu/wp-content/uploads/2014/11/OCLM.Tech_.Web_.pdf Accessed 1 November 2026.grey
- Hershbein, B. and Kahn, L. B. (2018). Do Recessions Accelerate Routine-Biased Technological Change? Evidence from Vacancy Postings. American Economic Review 108(7): 1737-1772. DOI 10.1257/aer.20161570. URL https://www.aeaweb.org/articles?id=10.1257/aer.20161570 Accessed 1 November 2026.peer-reviewed
Cite this report
Job Opportunities API (2026). JOA Job Market Report, October 2026 edition (snapshot of 31 October 2026). https://jobopportunitiesapi.org/reports/job-market-october-2026. CC BY 4.0.
Canonical address: https://jobopportunitiesapi.org/reports/job-market-october-2026
Report and data (aggregate tables): https://doi.org/10.5281/zenodo.23880291
Licence
This report, its charts and its data files are published under CC BY 4.0. You may copy, redistribute and adapt them, including commercially, as long as you credit Job Opportunities API and link to this page.
Report an error or give feedback
Spotted a wrong number, a missing source or a claim that goes further than the data? Tell us: email the report team. Methodology limits are stated next to each result; corrections are logged in the page's update date above.